Immigrants from Australia Self-Care Disability

COMPARE

Immigrants from Australia
Race
Ancestry
AfghanAfricanAlaska NativeAlaskan AthabascanAlbanianAleutAlsatianAmericanApacheArabArapahoArgentineanArmenianAssyrian/Chaldean/SyriacAustralianAustrianBahamianBangladeshiBarbadianBasqueBelgianBelizeanBermudanBhutaneseBlackfeetBolivianBrazilianBritishBritish West IndianBulgarianBurmeseCajunCambodianCanadianCape VerdeanCarpatho RusynCelticCentral AmericanCentral American IndianCherokeeCheyenneChickasawChileanChineseChippewaChoctawColombianColvilleComancheCosta RicanCreeCreekCroatianCrowCubanCypriotCzechCzechoslovakianDanishDelawareDominicanDutchDutch West IndianEastern EuropeanEcuadorianEgyptianEnglishEstonianEthiopianEuropeanFijianFilipinoFinnishFrenchFrench American IndianFrench CanadianGermanGerman RussianGhanaianGreekGuamanian/ChamorroGuatemalanGuyaneseHaitianHmongHonduranHopiHoumaHungarianIcelanderIndian (Asian)IndonesianInupiatIranianIraqiIrishIroquoisIsraeliItalianJamaicanJapaneseJordanianKenyanKiowaKoreanLaotianLatvianLebaneseLiberianLithuanianLumbeeLuxembourgerMacedonianMalaysianMalteseMarshalleseMenomineeMexicanMexican American IndianMongolianMoroccanNative HawaiianNavajoNepaleseNew ZealanderNicaraguanNigerianNorthern EuropeanNorwegianOkinawanOsageOttawaPaiutePakistaniPalestinianPanamanianParaguayanPennsylvania GermanPeruvianPimaPolishPortuguesePotawatomiPuebloPuerto RicanPuget Sound SalishRomanianRussianSalvadoranSamoanScandinavianScotch-IrishScottishSeminoleSenegaleseSerbianShoshoneSierra LeoneanSiouxSlavicSlovakSloveneSomaliSouth AfricanSouth AmericanSouth American IndianSoviet UnionSpaniardSpanishSpanish AmericanSpanish American IndianSri LankanSubsaharan AfricanSudaneseSwedishSwissSyrianTaiwaneseThaiTlingit-HaidaTohono O'OdhamTonganTrinidadian and TobagonianTsimshianTurkishU.S. Virgin IslanderUgandanUkrainianUruguayanUteVenezuelanVietnameseWelshWest IndianYakamaYaquiYugoslavianYumanYup'ikZimbabwean
Immigration
NonimmigrantsImmigrantsAfghanistanAfricaAlbaniaArgentinaArmeniaAsiaAustraliaAustriaBahamasBangladeshBarbadosBelarusBelgiumBelizeBoliviaBosnia and HerzegovinaBrazilBulgariaBurma/MyanmarCabo VerdeCambodiaCameroonCanadaCaribbeanCentral AmericaChileChinaColombiaCongoCosta RicaCroatiaCubaCzechoslovakiaDenmarkDominicaDominican RepublicEastern AfricaEastern AsiaEastern EuropeEcuadorEgyptEl SalvadorEnglandEritreaEthiopiaEuropeFijiFranceGermanyGhanaGreeceGrenadaGuatemalaGuyanaHaitiHondurasHong KongHungaryIndiaIndonesiaIranIraqIrelandIsraelItalyJamaicaJapanJordanKazakhstanKenyaKoreaKuwaitLaosLatin AmericaLatviaLebanonLiberiaLithuaniaMalaysiaMexicoMicronesiaMiddle AfricaMoldovaMoroccoNepalNetherlandsNicaraguaNigeriaNorth AmericaNorth MacedoniaNorthern AfricaNorthern EuropeNorwayOceaniaPakistanPanamaPeruPhilippinesPolandPortugalRomaniaRussiaSaudi ArabiaScotlandSenegalSerbiaSierra LeoneSingaporeSomaliaSouth AfricaSouth AmericaSouth Central AsiaSouth Eastern AsiaSouthern EuropeSpainSri LankaSt. Vincent and the GrenadinesSudanSwedenSwitzerlandSyriaTaiwanThailandTrinidad and TobagoTurkeyUgandaUkraineUruguayUzbekistanVenezuelaVietnamWest IndiesWestern AfricaWestern AsiaWestern EuropeYemenZaireZimbabweAzores
Select to Compare
Race
Ancestry
AfghanAfricanAlaska NativeAlaskan AthabascanAlbanianAleutAlsatianAmericanApacheArabArapahoArgentineanArmenianAssyrian/Chaldean/SyriacAustralianAustrianBahamianBangladeshiBarbadianBasqueBelgianBelizeanBermudanBhutaneseBlackfeetBolivianBrazilianBritishBritish West IndianBulgarianBurmeseCajunCambodianCanadianCape VerdeanCarpatho RusynCelticCentral AmericanCentral American IndianCherokeeCheyenneChickasawChileanChineseChippewaChoctawColombianColvilleComancheCosta RicanCreeCreekCroatianCrowCubanCypriotCzechCzechoslovakianDanishDelawareDominicanDutchDutch West IndianEastern EuropeanEcuadorianEgyptianEnglishEstonianEthiopianEuropeanFijianFilipinoFinnishFrenchFrench American IndianFrench CanadianGermanGerman RussianGhanaianGreekGuamanian/ChamorroGuatemalanGuyaneseHaitianHmongHonduranHopiHoumaHungarianIcelanderIndian (Asian)IndonesianInupiatIranianIraqiIrishIroquoisIsraeliItalianJamaicanJapaneseJordanianKenyanKiowaKoreanLaotianLatvianLebaneseLiberianLithuanianLumbeeLuxembourgerMacedonianMalaysianMalteseMarshalleseMenomineeMexicanMexican American IndianMongolianMoroccanNative HawaiianNavajoNepaleseNew ZealanderNicaraguanNigerianNorthern EuropeanNorwegianOkinawanOsageOttawaPaiutePakistaniPalestinianPanamanianParaguayanPennsylvania GermanPeruvianPimaPolishPortuguesePotawatomiPuebloPuerto RicanPuget Sound SalishRomanianRussianSalvadoranSamoanScandinavianScotch-IrishScottishSeminoleSenegaleseSerbianShoshoneSierra LeoneanSiouxSlavicSlovakSloveneSomaliSouth AfricanSouth AmericanSouth American IndianSoviet UnionSpaniardSpanishSpanish AmericanSpanish American IndianSri LankanSubsaharan AfricanSudaneseSwedishSwissSyrianTaiwaneseThaiTlingit-HaidaTohono O'OdhamTonganTrinidadian and TobagonianTsimshianTurkishU.S. Virgin IslanderUgandanUkrainianUruguayanUteVenezuelanVietnameseWelshWest IndianYakamaYaquiYugoslavianYumanYup'ikZimbabwean
Immigration
NonimmigrantsImmigrantsAfghanistanAfricaAlbaniaArgentinaArmeniaAsiaAustriaBahamasBangladeshBarbadosBelarusBelgiumBelizeBoliviaBosnia and HerzegovinaBrazilBulgariaBurma/MyanmarCabo VerdeCambodiaCameroonCanadaCaribbeanCentral AmericaChileChinaColombiaCongoCosta RicaCroatiaCubaCzechoslovakiaDenmarkDominicaDominican RepublicEastern AfricaEastern AsiaEastern EuropeEcuadorEgyptEl SalvadorEnglandEritreaEthiopiaEuropeFijiFranceGermanyGhanaGreeceGrenadaGuatemalaGuyanaHaitiHondurasHong KongHungaryIndiaIndonesiaIranIraqIrelandIsraelItalyJamaicaJapanJordanKazakhstanKenyaKoreaKuwaitLaosLatin AmericaLatviaLebanonLiberiaLithuaniaMalaysiaMexicoMicronesiaMiddle AfricaMoldovaMoroccoNepalNetherlandsNicaraguaNigeriaNorth AmericaNorth MacedoniaNorthern AfricaNorthern EuropeNorwayOceaniaPakistanPanamaPeruPhilippinesPolandPortugalRomaniaRussiaSaudi ArabiaScotlandSenegalSerbiaSierra LeoneSingaporeSomaliaSouth AfricaSouth AmericaSouth Central AsiaSouth Eastern AsiaSouthern EuropeSpainSri LankaSt. Vincent and the GrenadinesSudanSwedenSwitzerlandSyriaTaiwanThailandTrinidad and TobagoTurkeyUgandaUkraineUruguayUzbekistanVenezuelaVietnamWest IndiesWestern AfricaWestern AsiaWestern EuropeYemenZaireZimbabweAzores
Self-Care Disability
Income
Poverty
Unemployment
Labor Participation
Family Structure
Vehicle Availability
Education Level
Disability

Immigrants from Australia Self-Care Disability
Exceptional

2.3%
SELF-CARE DISABILITY
99.9/ 100
METRIC RATING
35th/ 347
METRIC RANK

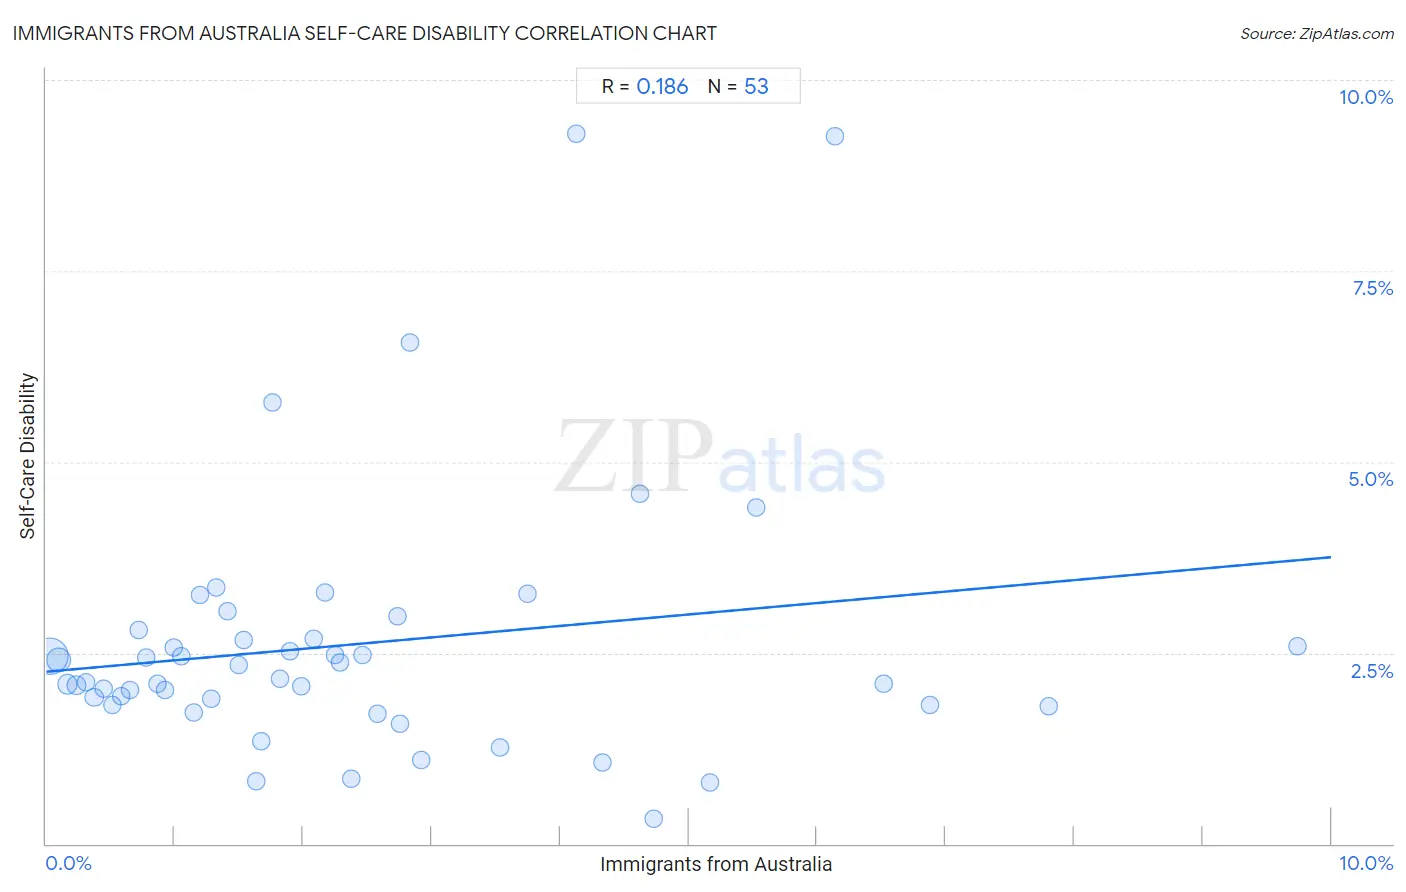
Immigrants from Australia Self-Care Disability Correlation Chart

The statistical analysis conducted on geographies consisting of 227,025,526 people shows a poor positive correlation between the proportion of Immigrants from Australia and percentage of population with self-care disability in the United States with a correlation coefficient (R) of 0.186 and weighted average of 2.3%. On average, for every 1% (one percent) increase in Immigrants from Australia within a typical geography, there is an increase of 0.15% in percentage of population with self-care disability.
Immigrants from Australia Self-Care Disability
It is essential to understand that the correlation between the percentage of Immigrants from Australia and percentage of population with self-care disability does not imply a direct cause-and-effect relationship. It remains uncertain whether the presence of Immigrants from Australia influences an upward or downward trend in the level of percentage of population with self-care disability within an area, or if Immigrants from Australia simply ended up residing in those areas with higher or lower levels of percentage of population with self-care disability due to other factors.

Demographics Similar to Immigrants from Australia by Self-Care Disability

In terms of self-care disability, the demographic groups most similar to Immigrants from Australia are Immigrants from Lithuania (2.3%, a difference of 0.010%), Immigrants from Turkey (2.3%, a difference of 0.060%), Immigrants from Korea (2.3%, a difference of 0.12%), Immigrants from Sweden (2.3%, a difference of 0.18%), and Immigrants from Eastern Africa (2.3%, a difference of 0.31%).
DemographicsRating | RankSelf-Care Disability
Inupiat
99.9
/100
|
#28
Exceptional
2.2%
Immigrants from Zimbabwe
99.9
/100
|
#29
Exceptional
2.3%
Paraguayans
99.9
/100
|
#30
Exceptional
2.3%
Danes
99.9
/100
|
#31
Exceptional
2.3%
Burmese
99.9
/100
|
#32
Exceptional
2.3%
Immigrants from Korea
99.9
/100
|
#33
Exceptional
2.3%
Immigrants from Turkey
99.9
/100
|
#34
Exceptional
2.3%
Immigrants from Australia
99.9
/100
|
#35
Exceptional
2.3%
Immigrants from Lithuania
99.9
/100
|
#36
Exceptional
2.3%
Immigrants from Sweden
99.9
/100
|
#37
Exceptional
2.3%
Immigrants from Eastern Africa
99.9
/100
|
#38
Exceptional
2.3%
Immigrants from Bulgaria
99.8
/100
|
#39
Exceptional
2.3%
Iranians
99.8
/100
|
#40
Exceptional
2.3%
Immigrants from Sudan
99.8
/100
|
#41
Exceptional
2.3%
Immigrants from Uganda
99.8
/100
|
#42
Exceptional
2.3%

Immigrants from Australia Self-Care Disability Correlation Summary

MeasurementImmigrants from Australia DataSelf-Care Disability Data
Minimum0.030%0.32%
Maximum9.7%9.3%
Range9.7%9.0%
Mean2.4%2.6%
Median1.8%2.2%
Interquartile 25% (IQ1)0.90%1.8%
Interquartile 75% (IQ3)3.2%2.7%
Interquartile Range (IQR)2.3%0.93%
Standard Deviation (Sample)2.1%1.7%
Standard Deviation (Population)2.1%1.7%

Correlation Details

Immigrants from Australia PercentileSample SizeSelf-Care Disability
[
0.0%
-
0.5%
]
0.030%
148,045,4312.5%
[
0.0%
-
0.5%
]
0.099%
50,248,8192.4%
[
0.0%
-
0.5%
]
0.16%
12,160,3502.1%
[
0.0%
-
0.5%
]
0.24%
6,384,5242.1%
[
0.0%
-
0.5%
]
0.31%
2,827,7862.1%
[
0.0%
-
0.5%
]
0.37%
2,563,3461.9%
[
0.0%
-
0.5%
]
0.44%
1,333,3392.0%
[
0.5%
-
1.0%
]
0.51%
1,080,6031.8%
[
0.5%
-
1.0%
]
0.58%
788,5821.9%
[
0.5%
-
1.0%
]
0.66%
351,8712.0%
[
0.5%
-
1.0%
]
0.72%
236,0702.8%
[
0.5%
-
1.0%
]
0.78%
277,5302.4%
[
0.5%
-
1.0%
]
0.87%
99,0232.1%
[
0.5%
-
1.0%
]
0.92%
105,5772.0%
[
0.5%
-
1.0%
]
0.99%
74,8252.6%
[
1.0%
-
1.5%
]
1.05%
12,7082.4%
[
1.0%
-
1.5%
]
1.15%
89,4201.7%
[
1.0%
-
1.5%
]
1.20%
89,4233.3%
[
1.0%
-
1.5%
]
1.28%
37,6671.9%
[
1.0%
-
1.5%
]
1.32%
36,2573.4%
[
1.0%
-
1.5%
]
1.41%
15,6443.0%
[
1.5%
-
2.0%
]
1.50%
37,1732.3%
[
1.5%
-
2.0%
]
1.54%
2,2092.7%
[
1.5%
-
2.0%
]
1.63%
7,8510.81%
[
1.5%
-
2.0%
]
1.67%
3,2941.3%
[
1.5%
-
2.0%
]
1.76%
5,7915.8%
[
1.5%
-
2.0%
]
1.82%
29,1332.2%
[
1.5%
-
2.0%
]
1.90%
9,0162.5%
[
1.5%
-
2.0%
]
1.99%
2,3162.1%
[
2.0%
-
2.5%
]
2.08%
5282.7%
[
2.0%
-
2.5%
]
2.16%
3,5113.3%
[
2.0%
-
2.5%
]
2.25%
5,8242.5%
[
2.0%
-
2.5%
]
2.28%
2,1912.4%
[
2.0%
-
2.5%
]
2.38%
8,3250.86%
[
2.0%
-
2.5%
]
2.46%
5,4782.5%
[
2.5%
-
3.0%
]
2.58%
3,8421.7%
[
2.5%
-
3.0%
]
2.74%
14,5783.0%
[
2.5%
-
3.0%
]
2.75%
5,4471.6%
[
2.5%
-
3.0%
]
2.83%
2,0516.6%
[
2.5%
-
3.0%
]
2.92%
10,2741.1%
[
3.5%
-
4.0%
]
3.54%
3961.3%
[
3.5%
-
4.0%
]
3.75%
7743.3%
[
4.0%
-
4.5%
]
4.12%
979.3%
[
4.0%
-
4.5%
]
4.33%
3001.1%
[
4.5%
-
5.0%
]
4.62%
1,5374.6%
[
4.5%
-
5.0%
]
4.72%
6350.32%
[
5.0%
-
5.5%
]
5.17%
2710.80%
[
5.5%
-
6.0%
]
5.52%
3264.4%
[
6.0%
-
6.5%
]
6.14%
2779.3%
[
6.5%
-
7.0%
]
6.51%
6142.1%
[
6.5%
-
7.0%
]
6.88%
8001.8%
[
7.5%
-
8.0%
]
7.80%
1,3071.8%
[
9.5%
-
10.0%
]
9.73%
5652.6%