Immigrants from Dominican Republic Self-Care Disability
COMPARE
Immigrants from Dominican Republic
Select to Compare
Self-Care Disability
Immigrants from Dominican Republic Self-Care Disability
3.0%
SELF-CARE DISABILITY
0.0/ 100
METRIC RATING
339th/ 347
METRIC RANK
Immigrants from Dominican Republic Self-Care Disability Correlation Chart
The statistical analysis conducted on geographies consisting of 274,850,038 people shows a mild positive correlation between the proportion of Immigrants from Dominican Republic and percentage of population with self-care disability in the United States with a correlation coefficient (R) of 0.357 and weighted average of 3.0%. On average, for every 1% (one percent) increase in Immigrants from Dominican Republic within a typical geography, there is an increase of 0.039% in percentage of population with self-care disability.
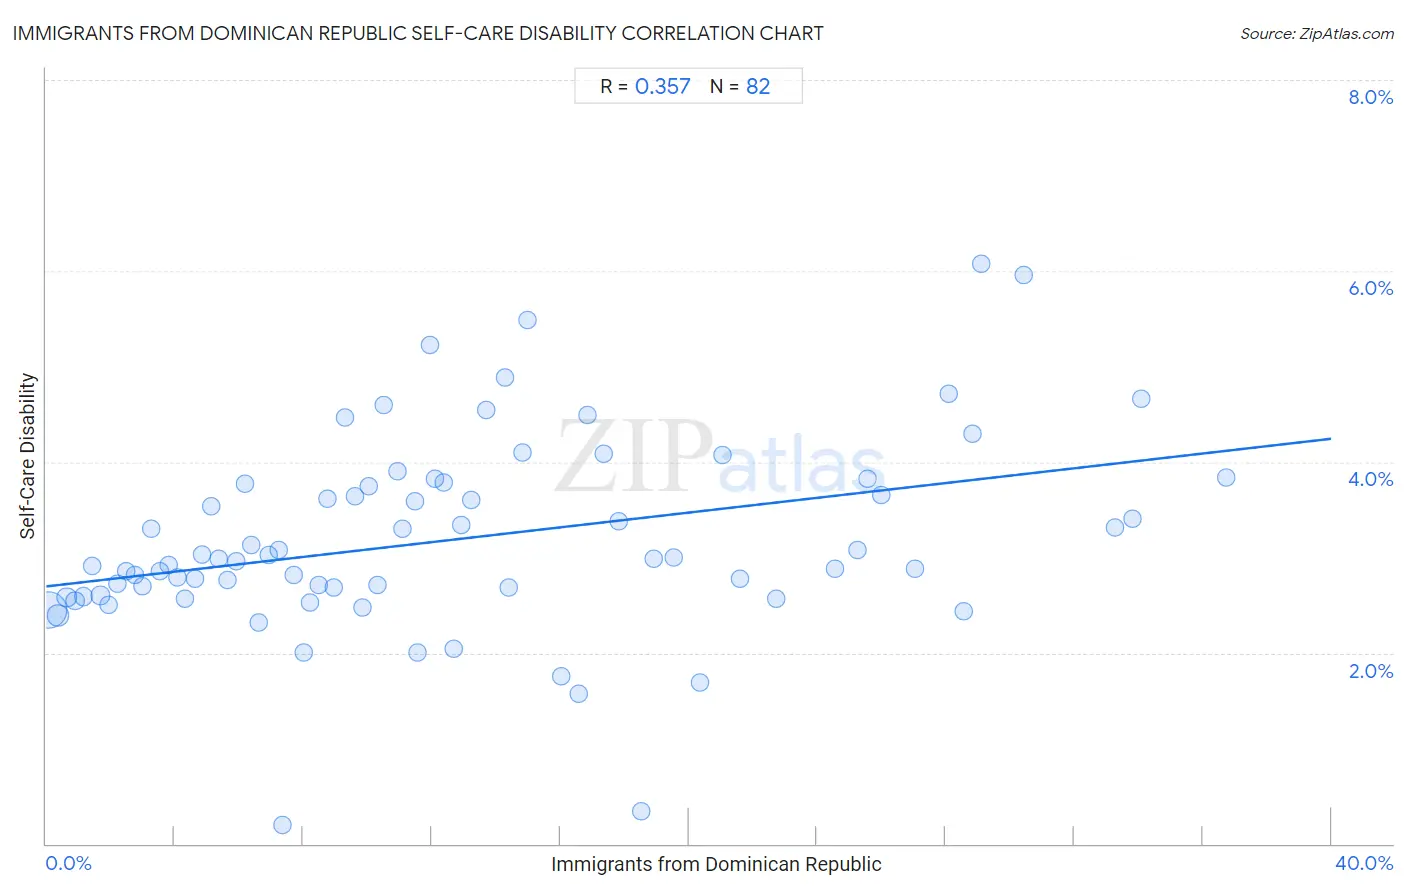
It is essential to understand that the correlation between the percentage of Immigrants from Dominican Republic and percentage of population with self-care disability does not imply a direct cause-and-effect relationship. It remains uncertain whether the presence of Immigrants from Dominican Republic influences an upward or downward trend in the level of percentage of population with self-care disability within an area, or if Immigrants from Dominican Republic simply ended up residing in those areas with higher or lower levels of percentage of population with self-care disability due to other factors.
Demographics Similar to Immigrants from Dominican Republic by Self-Care Disability
In terms of self-care disability, the demographic groups most similar to Immigrants from Dominican Republic are Immigrants from Cabo Verde (3.1%, a difference of 0.33%), Cape Verdean (3.0%, a difference of 0.38%), Dominican (3.1%, a difference of 0.59%), Choctaw (3.0%, a difference of 0.69%), and Immigrants from Yemen (3.0%, a difference of 1.8%).
| Demographics | Rating | Rank | Self-Care Disability |
| Kiowa | 0.0 /100 | #332 | Tragic 3.0% |
| Dutch West Indians | 0.0 /100 | #333 | Tragic 3.0% |
| Houma | 0.0 /100 | #334 | Tragic 3.0% |
| Immigrants from the Azores | 0.0 /100 | #335 | Tragic 3.0% |
| Immigrants from Yemen | 0.0 /100 | #336 | Tragic 3.0% |
| Choctaw | 0.0 /100 | #337 | Tragic 3.0% |
| Cape Verdeans | 0.0 /100 | #338 | Tragic 3.0% |
| Immigrants from Dominican Republic | 0.0 /100 | #339 | Tragic 3.0% |
| Immigrants from Cabo Verde | 0.0 /100 | #340 | Tragic 3.1% |
| Dominicans | 0.0 /100 | #341 | Tragic 3.1% |
| Colville | 0.0 /100 | #342 | Tragic 3.1% |
| Tohono O'odham | 0.0 /100 | #343 | Tragic 3.1% |
| Pueblo | 0.0 /100 | #344 | Tragic 3.3% |
| Armenians | 0.0 /100 | #345 | Tragic 3.4% |
| Puerto Ricans | 0.0 /100 | #346 | Tragic 3.7% |
Immigrants from Dominican Republic Self-Care Disability Correlation Summary
| Measurement | Immigrants from Dominican Republic Data | Self-Care Disability Data |
| Minimum | 0.075% | 0.19% |
| Maximum | 36.7% | 6.1% |
| Range | 36.7% | 5.9% |
| Mean | 12.8% | 3.2% |
| Median | 10.7% | 3.0% |
| Interquartile 25% (IQ1) | 5.4% | 2.6% |
| Interquartile 75% (IQ3) | 18.5% | 3.8% |
| Interquartile Range (IQR) | 13.2% | 1.2% |
| Standard Deviation (Sample) | 9.4% | 1.0% |
| Standard Deviation (Population) | 9.4% | 1.0% |
Correlation Details
| Immigrants from Dominican Republic Percentile | Sample Size | Self-Care Disability |
[ 0.0% - 0.5% ] 0.075% | 178,635,649 | 2.5% |
[ 0.0% - 0.5% ] 0.37% | 27,055,661 | 2.4% |
[ 0.5% - 1.0% ] 0.64% | 13,880,459 | 2.6% |
[ 0.5% - 1.0% ] 0.91% | 9,350,060 | 2.5% |
[ 1.0% - 1.5% ] 1.17% | 5,850,788 | 2.6% |
[ 1.0% - 1.5% ] 1.42% | 6,137,965 | 2.9% |
[ 1.5% - 2.0% ] 1.69% | 4,020,608 | 2.6% |
[ 1.5% - 2.0% ] 1.93% | 2,807,603 | 2.5% |
[ 2.0% - 2.5% ] 2.22% | 1,866,480 | 2.7% |
[ 2.0% - 2.5% ] 2.49% | 1,036,734 | 2.9% |
[ 2.5% - 3.0% ] 2.75% | 1,400,580 | 2.8% |
[ 3.0% - 3.5% ] 3.01% | 1,047,729 | 2.7% |
[ 3.0% - 3.5% ] 3.26% | 1,114,008 | 3.3% |
[ 3.5% - 4.0% ] 3.54% | 1,569,503 | 2.9% |
[ 3.5% - 4.0% ] 3.80% | 602,750 | 2.9% |
[ 4.0% - 4.5% ] 4.09% | 1,245,121 | 2.8% |
[ 4.0% - 4.5% ] 4.32% | 760,794 | 2.6% |
[ 4.5% - 5.0% ] 4.62% | 73,469 | 2.8% |
[ 4.5% - 5.0% ] 4.85% | 8,832,038 | 3.0% |
[ 5.0% - 5.5% ] 5.12% | 500,200 | 3.5% |
[ 5.0% - 5.5% ] 5.35% | 539,868 | 3.0% |
[ 5.5% - 6.0% ] 5.64% | 336,274 | 2.8% |
[ 5.5% - 6.0% ] 5.92% | 184,343 | 3.0% |
[ 6.0% - 6.5% ] 6.17% | 209,659 | 3.8% |
[ 6.0% - 6.5% ] 6.39% | 428,632 | 3.1% |
[ 6.5% - 7.0% ] 6.60% | 103,206 | 2.3% |
[ 6.5% - 7.0% ] 6.92% | 181,875 | 3.0% |
[ 7.0% - 7.5% ] 7.24% | 210,882 | 3.1% |
[ 7.0% - 7.5% ] 7.36% | 1,032 | 0.19% |
[ 7.5% - 8.0% ] 7.71% | 99,242 | 2.8% |
[ 8.0% - 8.5% ] 8.00% | 93,217 | 2.0% |
[ 8.0% - 8.5% ] 8.22% | 147,671 | 2.5% |
[ 8.0% - 8.5% ] 8.49% | 81,220 | 2.7% |
[ 8.5% - 9.0% ] 8.77% | 516,513 | 3.6% |
[ 8.5% - 9.0% ] 8.96% | 67,652 | 2.7% |
[ 9.0% - 9.5% ] 9.29% | 59,235 | 4.5% |
[ 9.5% - 10.0% ] 9.60% | 105,250 | 3.6% |
[ 9.5% - 10.0% ] 9.83% | 325,282 | 2.5% |
[ 10.0% - 10.5% ] 10.04% | 62,824 | 3.7% |
[ 10.0% - 10.5% ] 10.30% | 224,927 | 2.7% |
[ 10.5% - 11.0% ] 10.50% | 55,303 | 4.6% |
[ 10.5% - 11.0% ] 10.95% | 114,608 | 3.9% |
[ 11.0% - 11.5% ] 11.07% | 218,026 | 3.3% |
[ 11.0% - 11.5% ] 11.50% | 13,309 | 3.6% |
[ 11.5% - 12.0% ] 11.54% | 4,738 | 2.0% |
[ 11.5% - 12.0% ] 11.96% | 30,126 | 5.2% |
[ 12.0% - 12.5% ] 12.12% | 197,592 | 3.8% |
[ 12.0% - 12.5% ] 12.38% | 120,102 | 3.8% |
[ 12.5% - 13.0% ] 12.67% | 10,396 | 2.0% |
[ 12.5% - 13.0% ] 12.90% | 97,787 | 3.3% |
[ 13.0% - 13.5% ] 13.23% | 320,831 | 3.6% |
[ 13.5% - 14.0% ] 13.70% | 73,556 | 4.5% |
[ 14.0% - 14.5% ] 14.27% | 88,575 | 4.9% |
[ 14.0% - 14.5% ] 14.40% | 51,640 | 2.7% |
[ 14.5% - 15.0% ] 14.83% | 61,238 | 4.1% |
[ 14.5% - 15.0% ] 14.97% | 51,964 | 5.5% |
[ 16.0% - 16.5% ] 16.03% | 140,096 | 1.7% |
[ 16.5% - 17.0% ] 16.58% | 7,822 | 1.6% |
[ 16.5% - 17.0% ] 16.86% | 59,852 | 4.5% |
[ 17.0% - 17.5% ] 17.35% | 1,798 | 4.1% |
[ 17.5% - 18.0% ] 17.83% | 24,572 | 3.4% |
[ 18.5% - 19.0% ] 18.54% | 10,071 | 0.34% |
[ 18.5% - 19.0% ] 18.90% | 61,044 | 3.0% |
[ 19.5% - 20.0% ] 19.53% | 237,681 | 3.0% |
[ 20.0% - 20.5% ] 20.35% | 25,674 | 1.7% |
[ 21.0% - 21.5% ] 21.07% | 78,624 | 4.1% |
[ 21.5% - 22.0% ] 21.61% | 93,747 | 2.8% |
[ 22.5% - 23.0% ] 22.73% | 13,781 | 2.6% |
[ 24.5% - 25.0% ] 24.54% | 20,269 | 2.9% |
[ 25.0% - 25.5% ] 25.27% | 35,492 | 3.1% |
[ 25.5% - 26.0% ] 25.55% | 100,504 | 3.8% |
[ 25.5% - 26.0% ] 25.99% | 100,281 | 3.6% |
[ 27.0% - 27.5% ] 27.05% | 31,519 | 2.9% |
[ 28.0% - 28.5% ] 28.11% | 60,480 | 4.7% |
[ 28.5% - 29.0% ] 28.56% | 29,671 | 2.4% |
[ 28.5% - 29.0% ] 28.84% | 109,749 | 4.3% |
[ 29.0% - 29.5% ] 29.09% | 58,136 | 6.1% |
[ 30.0% - 30.5% ] 30.42% | 55,226 | 6.0% |
[ 33.0% - 33.5% ] 33.25% | 43,653 | 3.3% |
[ 33.5% - 34.0% ] 33.83% | 32,697 | 3.4% |
[ 34.0% - 34.5% ] 34.08% | 88,067 | 4.7% |
[ 36.5% - 37.0% ] 36.74% | 52,738 | 3.8% |