Scotch-Irish Female Disability
COMPARE
Scotch-Irish
Select to Compare
Female Disability
Scotch-Irish Female Disability
13.4%
DISABILITY | FEMALES
0.0/ 100
METRIC RATING
302nd/ 347
METRIC RANK
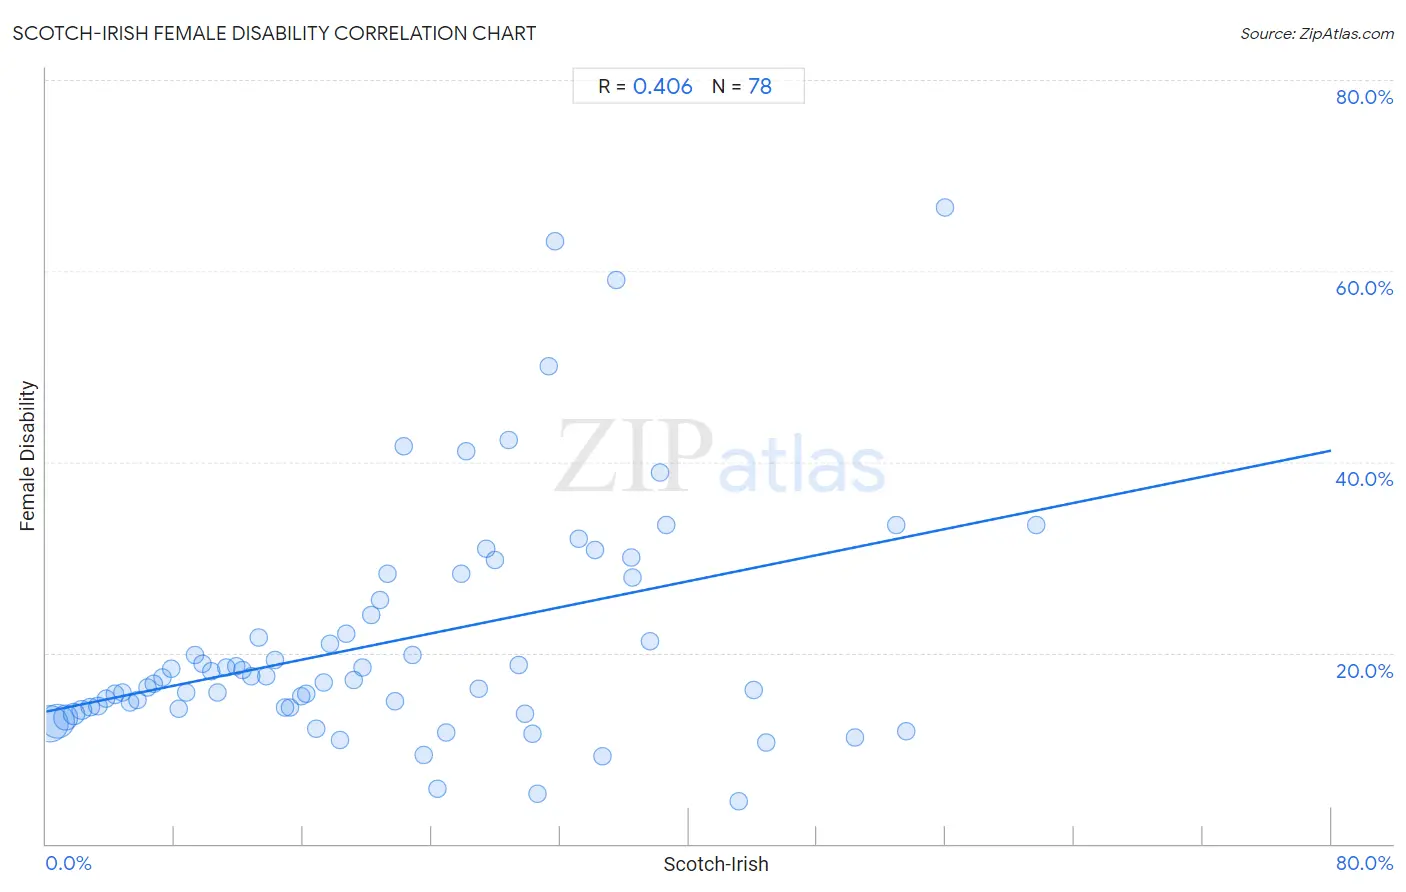
Scotch-Irish Female Disability Correlation Chart
The statistical analysis conducted on geographies consisting of 548,573,243 people shows a moderate positive correlation between the proportion of Scotch-Irish and percentage of females with a disability in the United States with a correlation coefficient (R) of 0.406 and weighted average of 13.4%. On average, for every 1% (one percent) increase in Scotch-Irish within a typical geography, there is an increase of 0.34% in percentage of females with a disability.
It is essential to understand that the correlation between the percentage of Scotch-Irish and percentage of females with a disability does not imply a direct cause-and-effect relationship. It remains uncertain whether the presence of Scotch-Irish influences an upward or downward trend in the level of percentage of females with a disability within an area, or if Scotch-Irish simply ended up residing in those areas with higher or lower levels of percentage of females with a disability due to other factors.
Demographics Similar to Scotch-Irish by Female Disability
In terms of female disability, the demographic groups most similar to Scotch-Irish are Immigrants from Portugal (13.5%, a difference of 0.0%), Immigrants from Micronesia (13.5%, a difference of 0.030%), African (13.4%, a difference of 0.14%), Pennsylvania German (13.4%, a difference of 0.34%), and Immigrants from Dominican Republic (13.4%, a difference of 0.35%).
| Demographics | Rating | Rank | Female Disability |
| French | 0.0 /100 | #295 | Tragic 13.3% |
| Nepalese | 0.0 /100 | #296 | Tragic 13.3% |
| Slovaks | 0.0 /100 | #297 | Tragic 13.3% |
| Nonimmigrants | 0.0 /100 | #298 | Tragic 13.4% |
| Immigrants from Dominican Republic | 0.0 /100 | #299 | Tragic 13.4% |
| Pennsylvania Germans | 0.0 /100 | #300 | Tragic 13.4% |
| Africans | 0.0 /100 | #301 | Tragic 13.4% |
| Scotch-Irish | 0.0 /100 | #302 | Tragic 13.4% |
| Immigrants from Portugal | 0.0 /100 | #303 | Tragic 13.5% |
| Immigrants from Micronesia | 0.0 /100 | #304 | Tragic 13.5% |
| Dominicans | 0.0 /100 | #305 | Tragic 13.5% |
| French Canadians | 0.0 /100 | #306 | Tragic 13.6% |
| Central American Indians | 0.0 /100 | #307 | Tragic 13.6% |
| Cree | 0.0 /100 | #308 | Tragic 13.7% |
| French American Indians | 0.0 /100 | #309 | Tragic 13.7% |
Scotch-Irish Female Disability Correlation Summary
| Measurement | Scotch-Irish Data | Female Disability Data |
| Minimum | 0.25% | 4.4% |
| Maximum | 61.7% | 66.7% |
| Range | 61.4% | 62.3% |
| Mean | 21.5% | 21.2% |
| Median | 19.5% | 17.3% |
| Interquartile 25% (IQ1) | 9.8% | 14.2% |
| Interquartile 75% (IQ3) | 30.6% | 25.5% |
| Interquartile Range (IQR) | 20.8% | 11.2% |
| Standard Deviation (Sample) | 14.6% | 12.3% |
| Standard Deviation (Population) | 14.5% | 12.2% |
Correlation Details
| Scotch-Irish Percentile | Sample Size | Female Disability |
[ 0.0% - 0.5% ] 0.25% | 210,752,086 | 12.6% |
[ 0.5% - 1.0% ] 0.72% | 183,250,481 | 12.9% |
[ 1.0% - 1.5% ] 1.21% | 82,699,874 | 13.2% |
[ 1.5% - 2.0% ] 1.72% | 36,472,238 | 13.6% |
[ 2.0% - 2.5% ] 2.21% | 15,906,332 | 14.1% |
[ 2.5% - 3.0% ] 2.73% | 7,862,419 | 14.3% |
[ 3.0% - 3.5% ] 3.23% | 5,128,337 | 14.4% |
[ 3.5% - 4.0% ] 3.75% | 2,462,277 | 15.2% |
[ 4.0% - 4.5% ] 4.25% | 1,276,971 | 15.7% |
[ 4.5% - 5.0% ] 4.76% | 748,394 | 15.9% |
[ 5.0% - 5.5% ] 5.23% | 643,078 | 14.8% |
[ 5.5% - 6.0% ] 5.71% | 324,331 | 15.0% |
[ 6.0% - 6.5% ] 6.29% | 209,380 | 16.3% |
[ 6.5% - 7.0% ] 6.71% | 138,576 | 16.7% |
[ 7.0% - 7.5% ] 7.24% | 121,938 | 17.5% |
[ 7.5% - 8.0% ] 7.79% | 112,836 | 18.3% |
[ 8.0% - 8.5% ] 8.22% | 76,555 | 14.1% |
[ 8.5% - 9.0% ] 8.75% | 61,311 | 15.8% |
[ 9.0% - 9.5% ] 9.25% | 40,511 | 19.7% |
[ 9.5% - 10.0% ] 9.76% | 38,516 | 18.9% |
[ 10.0% - 10.5% ] 10.27% | 37,718 | 18.1% |
[ 10.5% - 11.0% ] 10.70% | 27,206 | 15.9% |
[ 11.0% - 11.5% ] 11.24% | 20,175 | 18.5% |
[ 11.5% - 12.0% ] 11.80% | 17,004 | 18.6% |
[ 12.0% - 12.5% ] 12.23% | 9,236 | 18.2% |
[ 12.5% - 13.0% ] 12.75% | 5,136 | 17.5% |
[ 13.0% - 13.5% ] 13.22% | 18,587 | 21.5% |
[ 13.5% - 14.0% ] 13.70% | 16,429 | 17.5% |
[ 14.0% - 14.5% ] 14.26% | 16,125 | 19.3% |
[ 14.5% - 15.0% ] 14.85% | 3,225 | 14.3% |
[ 15.0% - 15.5% ] 15.17% | 6,541 | 14.2% |
[ 15.5% - 16.0% ] 15.86% | 5,175 | 15.4% |
[ 16.0% - 16.5% ] 16.21% | 10,977 | 15.7% |
[ 16.5% - 17.0% ] 16.81% | 5,163 | 12.1% |
[ 17.0% - 17.5% ] 17.25% | 7,820 | 16.9% |
[ 17.5% - 18.0% ] 17.66% | 9,586 | 21.0% |
[ 18.0% - 18.5% ] 18.30% | 2,180 | 10.9% |
[ 18.5% - 19.0% ] 18.65% | 2,970 | 21.9% |
[ 19.0% - 19.5% ] 19.18% | 2,200 | 17.1% |
[ 19.5% - 20.0% ] 19.73% | 1,171 | 18.4% |
[ 20.0% - 20.5% ] 20.25% | 726 | 24.0% |
[ 20.5% - 21.0% ] 20.74% | 2,748 | 25.5% |
[ 21.0% - 21.5% ] 21.23% | 1,220 | 28.3% |
[ 21.5% - 22.0% ] 21.72% | 1,395 | 14.9% |
[ 22.0% - 22.5% ] 22.22% | 18 | 41.7% |
[ 22.5% - 23.0% ] 22.77% | 1,458 | 19.7% |
[ 23.0% - 23.5% ] 23.48% | 903 | 9.3% |
[ 24.0% - 24.5% ] 24.34% | 189 | 5.8% |
[ 24.5% - 25.0% ] 24.88% | 1,656 | 11.6% |
[ 25.5% - 26.0% ] 25.83% | 724 | 28.3% |
[ 26.0% - 26.5% ] 26.17% | 405 | 41.1% |
[ 26.5% - 27.0% ] 26.91% | 431 | 16.3% |
[ 27.0% - 27.5% ] 27.43% | 175 | 30.8% |
[ 27.5% - 28.0% ] 27.91% | 86 | 29.8% |
[ 28.5% - 29.0% ] 28.81% | 354 | 42.2% |
[ 29.0% - 29.5% ] 29.42% | 469 | 18.8% |
[ 29.5% - 30.0% ] 29.83% | 905 | 13.7% |
[ 30.0% - 30.5% ] 30.25% | 2,876 | 11.5% |
[ 30.5% - 31.0% ] 30.57% | 386 | 5.2% |
[ 31.0% - 31.5% ] 31.25% | 32 | 50.0% |
[ 31.5% - 32.0% ] 31.65% | 79 | 63.2% |
[ 33.0% - 33.5% ] 33.12% | 157 | 31.9% |
[ 34.0% - 34.5% ] 34.17% | 1,080 | 30.8% |
[ 34.5% - 35.0% ] 34.62% | 234 | 9.2% |
[ 35.0% - 35.5% ] 35.46% | 141 | 59.1% |
[ 36.0% - 36.5% ] 36.40% | 728 | 30.0% |
[ 36.5% - 37.0% ] 36.51% | 556 | 27.9% |
[ 37.5% - 38.0% ] 37.58% | 157 | 21.2% |
[ 38.0% - 38.5% ] 38.18% | 55 | 38.9% |
[ 38.5% - 39.0% ] 38.61% | 101 | 33.3% |
[ 43.0% - 43.5% ] 43.13% | 473 | 4.4% |
[ 44.0% - 44.5% ] 44.08% | 338 | 16.1% |
[ 44.5% - 45.0% ] 44.84% | 339 | 10.7% |
[ 50.0% - 50.5% ] 50.34% | 149 | 11.1% |
[ 52.5% - 53.0% ] 52.94% | 17 | 33.3% |
[ 53.5% - 54.0% ] 53.51% | 299 | 11.7% |
[ 55.5% - 56.0% ] 55.93% | 59 | 66.7% |
[ 61.5% - 62.0% ] 61.67% | 60 | 33.3% |