Scotch-Irish Poverty
COMPARE
Scotch-Irish
Select to Compare
Poverty
Scotch-Irish Poverty
12.2%
POVERTY
62.6/ 100
METRIC RATING
156th/ 347
METRIC RANK
Scotch-Irish Poverty Correlation Chart
The statistical analysis conducted on geographies consisting of 548,217,294 people shows a weak positive correlation between the proportion of Scotch-Irish and poverty level in the United States with a correlation coefficient (R) of 0.291 and weighted average of 12.2%. On average, for every 1% (one percent) increase in Scotch-Irish within a typical geography, there is an increase of 0.23% in poverty level.
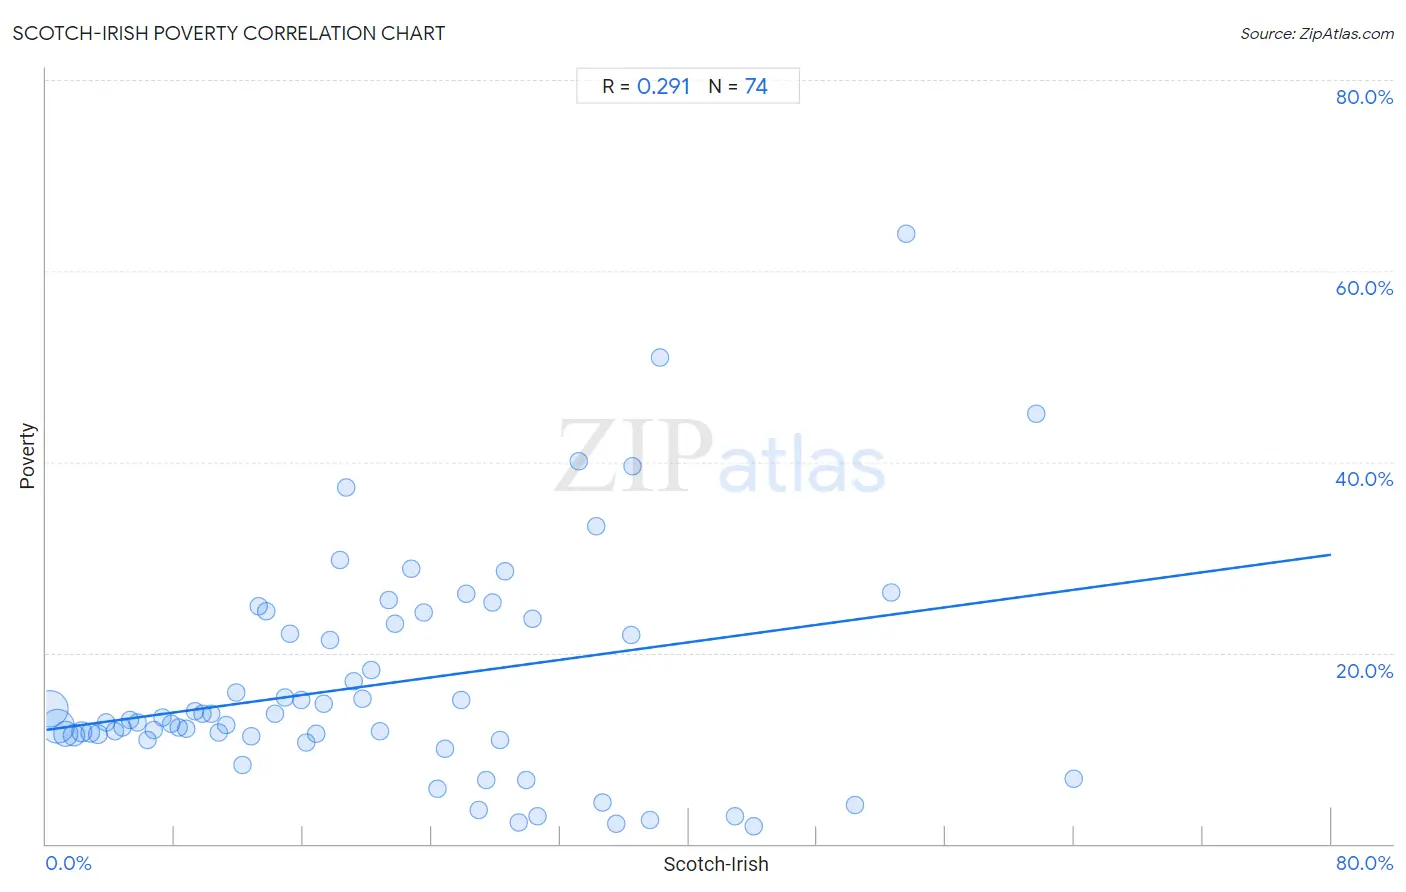
It is essential to understand that the correlation between the percentage of Scotch-Irish and poverty level does not imply a direct cause-and-effect relationship. It remains uncertain whether the presence of Scotch-Irish influences an upward or downward trend in the level of poverty level within an area, or if Scotch-Irish simply ended up residing in those areas with higher or lower levels of poverty level due to other factors.
Demographics Similar to Scotch-Irish by Poverty
In terms of poverty, the demographic groups most similar to Scotch-Irish are Costa Rican (12.2%, a difference of 0.040%), Taiwanese (12.2%, a difference of 0.080%), Hungarian (12.2%, a difference of 0.11%), Guamanian/Chamorro (12.1%, a difference of 0.14%), and Immigrants from Northern Africa (12.1%, a difference of 0.15%).
| Demographics | Rating | Rank | Poverty |
| Immigrants from Malaysia | 72.7 /100 | #149 | Good 12.0% |
| Immigrants from Kazakhstan | 72.3 /100 | #150 | Good 12.0% |
| Samoans | 71.9 /100 | #151 | Good 12.0% |
| Armenians | 67.6 /100 | #152 | Good 12.1% |
| Immigrants from Northern Africa | 63.9 /100 | #153 | Good 12.1% |
| Guamanians/Chamorros | 63.9 /100 | #154 | Good 12.1% |
| Hungarians | 63.6 /100 | #155 | Good 12.2% |
| Scotch-Irish | 62.6 /100 | #156 | Good 12.2% |
| Costa Ricans | 62.2 /100 | #157 | Good 12.2% |
| Taiwanese | 61.8 /100 | #158 | Good 12.2% |
| Pennsylvania Germans | 60.8 /100 | #159 | Good 12.2% |
| Immigrants from Nepal | 60.4 /100 | #160 | Good 12.2% |
| Immigrants from Fiji | 59.1 /100 | #161 | Average 12.2% |
| Ethiopians | 59.1 /100 | #162 | Average 12.2% |
| Immigrants from Ethiopia | 58.6 /100 | #163 | Average 12.2% |
Scotch-Irish Poverty Correlation Summary
| Measurement | Scotch-Irish Data | Poverty Data |
| Minimum | 0.25% | 1.8% |
| Maximum | 64.0% | 63.9% |
| Range | 63.7% | 62.1% |
| Mean | 20.9% | 16.7% |
| Median | 18.5% | 12.9% |
| Interquartile 25% (IQ1) | 9.2% | 11.3% |
| Interquartile 75% (IQ3) | 29.4% | 23.0% |
| Interquartile Range (IQR) | 20.2% | 11.7% |
| Standard Deviation (Sample) | 14.8% | 11.7% |
| Standard Deviation (Population) | 14.7% | 11.6% |
Correlation Details
| Scotch-Irish Percentile | Sample Size | Poverty |
[ 0.0% - 0.5% ] 0.25% | 210,599,881 | 14.2% |
[ 0.5% - 1.0% ] 0.72% | 183,188,669 | 12.3% |
[ 1.0% - 1.5% ] 1.21% | 82,663,426 | 11.5% |
[ 1.5% - 2.0% ] 1.72% | 36,431,098 | 11.3% |
[ 2.0% - 2.5% ] 2.21% | 15,894,057 | 11.7% |
[ 2.5% - 3.0% ] 2.73% | 7,855,561 | 11.6% |
[ 3.0% - 3.5% ] 3.23% | 5,118,720 | 11.5% |
[ 3.5% - 4.0% ] 3.75% | 2,452,886 | 12.7% |
[ 4.0% - 4.5% ] 4.25% | 1,270,960 | 11.8% |
[ 4.5% - 5.0% ] 4.76% | 745,676 | 12.2% |
[ 5.0% - 5.5% ] 5.23% | 640,532 | 13.0% |
[ 5.5% - 6.0% ] 5.71% | 326,176 | 12.8% |
[ 6.0% - 6.5% ] 6.28% | 207,122 | 10.9% |
[ 6.5% - 7.0% ] 6.71% | 139,133 | 12.0% |
[ 7.0% - 7.5% ] 7.23% | 119,597 | 13.3% |
[ 7.5% - 8.0% ] 7.79% | 111,915 | 12.6% |
[ 8.0% - 8.5% ] 8.22% | 76,831 | 12.2% |
[ 8.5% - 9.0% ] 8.75% | 60,424 | 12.0% |
[ 9.0% - 9.5% ] 9.25% | 38,930 | 13.9% |
[ 9.5% - 10.0% ] 9.76% | 38,106 | 13.7% |
[ 10.0% - 10.5% ] 10.27% | 37,288 | 13.6% |
[ 10.5% - 11.0% ] 10.70% | 26,216 | 11.7% |
[ 11.0% - 11.5% ] 11.24% | 19,317 | 12.4% |
[ 11.5% - 12.0% ] 11.80% | 17,942 | 15.8% |
[ 12.0% - 12.5% ] 12.22% | 8,537 | 8.3% |
[ 12.5% - 13.0% ] 12.75% | 3,679 | 11.3% |
[ 13.0% - 13.5% ] 13.22% | 18,944 | 24.8% |
[ 13.5% - 14.0% ] 13.71% | 16,723 | 24.4% |
[ 14.0% - 14.5% ] 14.25% | 15,194 | 13.6% |
[ 14.5% - 15.0% ] 14.83% | 3,466 | 15.4% |
[ 15.0% - 15.5% ] 15.17% | 5,760 | 22.1% |
[ 15.5% - 16.0% ] 15.86% | 4,843 | 15.0% |
[ 16.0% - 16.5% ] 16.21% | 10,977 | 10.6% |
[ 16.5% - 17.0% ] 16.81% | 4,776 | 11.6% |
[ 17.0% - 17.5% ] 17.24% | 7,320 | 14.7% |
[ 17.5% - 18.0% ] 17.67% | 8,834 | 21.4% |
[ 18.0% - 18.5% ] 18.29% | 1,925 | 29.7% |
[ 18.5% - 19.0% ] 18.65% | 2,970 | 37.3% |
[ 19.0% - 19.5% ] 19.12% | 957 | 17.0% |
[ 19.5% - 20.0% ] 19.71% | 1,324 | 15.2% |
[ 20.0% - 20.5% ] 20.27% | 597 | 18.2% |
[ 20.5% - 21.0% ] 20.75% | 2,709 | 11.8% |
[ 21.0% - 21.5% ] 21.28% | 1,090 | 25.5% |
[ 21.5% - 22.0% ] 21.70% | 1,562 | 23.0% |
[ 22.5% - 23.0% ] 22.74% | 1,262 | 28.8% |
[ 23.0% - 23.5% ] 23.48% | 903 | 24.2% |
[ 24.0% - 24.5% ] 24.34% | 189 | 5.8% |
[ 24.5% - 25.0% ] 24.86% | 1,943 | 10.0% |
[ 25.5% - 26.0% ] 25.83% | 724 | 15.1% |
[ 26.0% - 26.5% ] 26.17% | 405 | 26.2% |
[ 26.5% - 27.0% ] 26.91% | 431 | 3.5% |
[ 27.0% - 27.5% ] 27.40% | 208 | 6.7% |
[ 27.5% - 28.0% ] 27.78% | 144 | 25.3% |
[ 28.0% - 28.5% ] 28.26% | 92 | 10.9% |
[ 28.5% - 29.0% ] 28.57% | 119 | 28.6% |
[ 29.0% - 29.5% ] 29.42% | 469 | 2.2% |
[ 29.5% - 30.0% ] 29.86% | 807 | 6.7% |
[ 30.0% - 30.5% ] 30.25% | 2,757 | 23.6% |
[ 30.5% - 31.0% ] 30.57% | 386 | 2.8% |
[ 33.0% - 33.5% ] 33.12% | 157 | 40.1% |
[ 34.0% - 34.5% ] 34.26% | 683 | 33.2% |
[ 34.5% - 35.0% ] 34.59% | 185 | 4.3% |
[ 35.0% - 35.5% ] 35.46% | 141 | 2.1% |
[ 36.0% - 36.5% ] 36.40% | 728 | 21.8% |
[ 36.5% - 37.0% ] 36.53% | 605 | 39.5% |
[ 37.5% - 38.0% ] 37.58% | 157 | 2.5% |
[ 38.0% - 38.5% ] 38.18% | 55 | 50.9% |
[ 42.5% - 43.0% ] 42.86% | 35 | 2.9% |
[ 44.0% - 44.5% ] 44.08% | 338 | 1.8% |
[ 50.0% - 50.5% ] 50.34% | 149 | 4.0% |
[ 52.5% - 53.0% ] 52.63% | 38 | 26.3% |
[ 53.5% - 54.0% ] 53.51% | 299 | 63.9% |
[ 61.5% - 62.0% ] 61.67% | 60 | 45.0% |
[ 64.0% - 64.5% ] 64.00% | 175 | 6.9% |