Scotch-Irish Unemployment Among Women with Children Under 6 years

COMPARE

Scotch-Irish
Race
Ancestry
AfghanAfricanAlaska NativeAlaskan AthabascanAlbanianAleutAlsatianAmericanApacheArabArapahoArgentineanArmenianAssyrian/Chaldean/SyriacAustralianAustrianBahamianBangladeshiBarbadianBasqueBelgianBelizeanBermudanBhutaneseBlackfeetBolivianBrazilianBritishBritish West IndianBulgarianBurmeseCajunCambodianCanadianCape VerdeanCarpatho RusynCelticCentral AmericanCentral American IndianCherokeeCheyenneChickasawChileanChineseChippewaChoctawColombianColvilleComancheCosta RicanCreeCreekCroatianCrowCubanCypriotCzechCzechoslovakianDanishDelawareDominicanDutchDutch West IndianEastern EuropeanEcuadorianEgyptianEnglishEstonianEthiopianEuropeanFijianFilipinoFinnishFrenchFrench American IndianFrench CanadianGermanGerman RussianGhanaianGreekGuamanian/ChamorroGuatemalanGuyaneseHaitianHmongHonduranHopiHoumaHungarianIcelanderIndian (Asian)IndonesianInupiatIranianIraqiIrishIroquoisIsraeliItalianJamaicanJapaneseJordanianKenyanKiowaKoreanLaotianLatvianLebaneseLiberianLithuanianLumbeeLuxembourgerMacedonianMalaysianMalteseMarshalleseMenomineeMexicanMexican American IndianMongolianMoroccanNative HawaiianNavajoNepaleseNew ZealanderNicaraguanNigerianNorthern EuropeanNorwegianOkinawanOsageOttawaPaiutePakistaniPalestinianPanamanianParaguayanPennsylvania GermanPeruvianPimaPolishPortuguesePotawatomiPuebloPuerto RicanPuget Sound SalishRomanianRussianSalvadoranSamoanScandinavianScotch-IrishScottishSeminoleSenegaleseSerbianShoshoneSierra LeoneanSiouxSlavicSlovakSloveneSomaliSouth AfricanSouth AmericanSouth American IndianSoviet UnionSpaniardSpanishSpanish AmericanSpanish American IndianSri LankanSubsaharan AfricanSudaneseSwedishSwissSyrianTaiwaneseThaiTlingit-HaidaTohono O'OdhamTonganTrinidadian and TobagonianTsimshianTurkishU.S. Virgin IslanderUgandanUkrainianUruguayanUteVenezuelanVietnameseWelshWest IndianYakamaYaquiYugoslavianYumanYup'ikZimbabwean
Immigration
NonimmigrantsImmigrantsAfghanistanAfricaAlbaniaArgentinaArmeniaAsiaAustraliaAustriaBahamasBangladeshBarbadosBelarusBelgiumBelizeBoliviaBosnia and HerzegovinaBrazilBulgariaBurma/MyanmarCabo VerdeCambodiaCameroonCanadaCaribbeanCentral AmericaChileChinaColombiaCongoCosta RicaCroatiaCubaCzechoslovakiaDenmarkDominicaDominican RepublicEastern AfricaEastern AsiaEastern EuropeEcuadorEgyptEl SalvadorEnglandEritreaEthiopiaEuropeFijiFranceGermanyGhanaGreeceGrenadaGuatemalaGuyanaHaitiHondurasHong KongHungaryIndiaIndonesiaIranIraqIrelandIsraelItalyJamaicaJapanJordanKazakhstanKenyaKoreaKuwaitLaosLatin AmericaLatviaLebanonLiberiaLithuaniaMalaysiaMexicoMicronesiaMiddle AfricaMoldovaMoroccoNepalNetherlandsNicaraguaNigeriaNorth AmericaNorth MacedoniaNorthern AfricaNorthern EuropeNorwayOceaniaPakistanPanamaPeruPhilippinesPolandPortugalRomaniaRussiaSaudi ArabiaScotlandSenegalSerbiaSierra LeoneSingaporeSomaliaSouth AfricaSouth AmericaSouth Central AsiaSouth Eastern AsiaSouthern EuropeSpainSri LankaSt. Vincent and the GrenadinesSudanSwedenSwitzerlandSyriaTaiwanThailandTrinidad and TobagoTurkeyUgandaUkraineUruguayUzbekistanVenezuelaVietnamWest IndiesWestern AfricaWestern AsiaWestern EuropeYemenZaireZimbabweAzores
Select to Compare
Race
Ancestry
AfghanAfricanAlaska NativeAlaskan AthabascanAlbanianAleutAlsatianAmericanApacheArabArapahoArgentineanArmenianAssyrian/Chaldean/SyriacAustralianAustrianBahamianBangladeshiBarbadianBasqueBelgianBelizeanBermudanBhutaneseBlackfeetBolivianBrazilianBritishBritish West IndianBulgarianBurmeseCajunCambodianCanadianCape VerdeanCarpatho RusynCelticCentral AmericanCentral American IndianCherokeeCheyenneChickasawChileanChineseChippewaChoctawColombianColvilleComancheCosta RicanCreeCreekCroatianCrowCubanCypriotCzechCzechoslovakianDanishDelawareDominicanDutchDutch West IndianEastern EuropeanEcuadorianEgyptianEnglishEstonianEthiopianEuropeanFijianFilipinoFinnishFrenchFrench American IndianFrench CanadianGermanGerman RussianGhanaianGreekGuamanian/ChamorroGuatemalanGuyaneseHaitianHmongHonduranHopiHoumaHungarianIcelanderIndian (Asian)IndonesianInupiatIranianIraqiIrishIroquoisIsraeliItalianJamaicanJapaneseJordanianKenyanKiowaKoreanLaotianLatvianLebaneseLiberianLithuanianLumbeeLuxembourgerMacedonianMalaysianMalteseMarshalleseMenomineeMexicanMexican American IndianMongolianMoroccanNative HawaiianNavajoNepaleseNew ZealanderNicaraguanNigerianNorthern EuropeanNorwegianOkinawanOsageOttawaPaiutePakistaniPalestinianPanamanianParaguayanPennsylvania GermanPeruvianPimaPolishPortuguesePotawatomiPuebloPuerto RicanPuget Sound SalishRomanianRussianSalvadoranSamoanScandinavianScottishSeminoleSenegaleseSerbianShoshoneSierra LeoneanSiouxSlavicSlovakSloveneSomaliSouth AfricanSouth AmericanSouth American IndianSoviet UnionSpaniardSpanishSpanish AmericanSpanish American IndianSri LankanSubsaharan AfricanSudaneseSwedishSwissSyrianTaiwaneseThaiTlingit-HaidaTohono O'OdhamTonganTrinidadian and TobagonianTsimshianTurkishU.S. Virgin IslanderUgandanUkrainianUruguayanUteVenezuelanVietnameseWelshWest IndianYakamaYaquiYugoslavianYumanYup'ikZimbabwean
Immigration
NonimmigrantsImmigrantsAfghanistanAfricaAlbaniaArgentinaArmeniaAsiaAustraliaAustriaBahamasBangladeshBarbadosBelarusBelgiumBelizeBoliviaBosnia and HerzegovinaBrazilBulgariaBurma/MyanmarCabo VerdeCambodiaCameroonCanadaCaribbeanCentral AmericaChileChinaColombiaCongoCosta RicaCroatiaCubaCzechoslovakiaDenmarkDominicaDominican RepublicEastern AfricaEastern AsiaEastern EuropeEcuadorEgyptEl SalvadorEnglandEritreaEthiopiaEuropeFijiFranceGermanyGhanaGreeceGrenadaGuatemalaGuyanaHaitiHondurasHong KongHungaryIndiaIndonesiaIranIraqIrelandIsraelItalyJamaicaJapanJordanKazakhstanKenyaKoreaKuwaitLaosLatin AmericaLatviaLebanonLiberiaLithuaniaMalaysiaMexicoMicronesiaMiddle AfricaMoldovaMoroccoNepalNetherlandsNicaraguaNigeriaNorth AmericaNorth MacedoniaNorthern AfricaNorthern EuropeNorwayOceaniaPakistanPanamaPeruPhilippinesPolandPortugalRomaniaRussiaSaudi ArabiaScotlandSenegalSerbiaSierra LeoneSingaporeSomaliaSouth AfricaSouth AmericaSouth Central AsiaSouth Eastern AsiaSouthern EuropeSpainSri LankaSt. Vincent and the GrenadinesSudanSwedenSwitzerlandSyriaTaiwanThailandTrinidad and TobagoTurkeyUgandaUkraineUruguayUzbekistanVenezuelaVietnamWest IndiesWestern AfricaWestern AsiaWestern EuropeYemenZaireZimbabweAzores
Unemployment Among Women with Children Under 6 years
Income
Poverty
Unemployment
Labor Participation
Family Structure
Vehicle Availability
Education Level
Disability

Scotch-Irish Unemployment Among Women with Children Under 6 years
Tragic

8.4%
UNEMPLOYMENT | WOMEN W/ CHILDREN < 6
0.3/ 100
METRIC RATING
263rd/ 347
METRIC RANK

Scotch-Irish Unemployment Among Women with Children Under 6 years Correlation Chart

The statistical analysis conducted on geographies consisting of 365,350,902 people shows a very strong positive correlation between the proportion of Scotch-Irish and unemployment rate among women with children under the age of 6 in the United States with a correlation coefficient (R) of 0.801 and weighted average of 8.4%. On average, for every 1% (one percent) increase in Scotch-Irish within a typical geography, there is an increase of 4.4% in unemployment rate among women with children under the age of 6.
Scotch-Irish Unemployment Among Women with Children Under 6 years
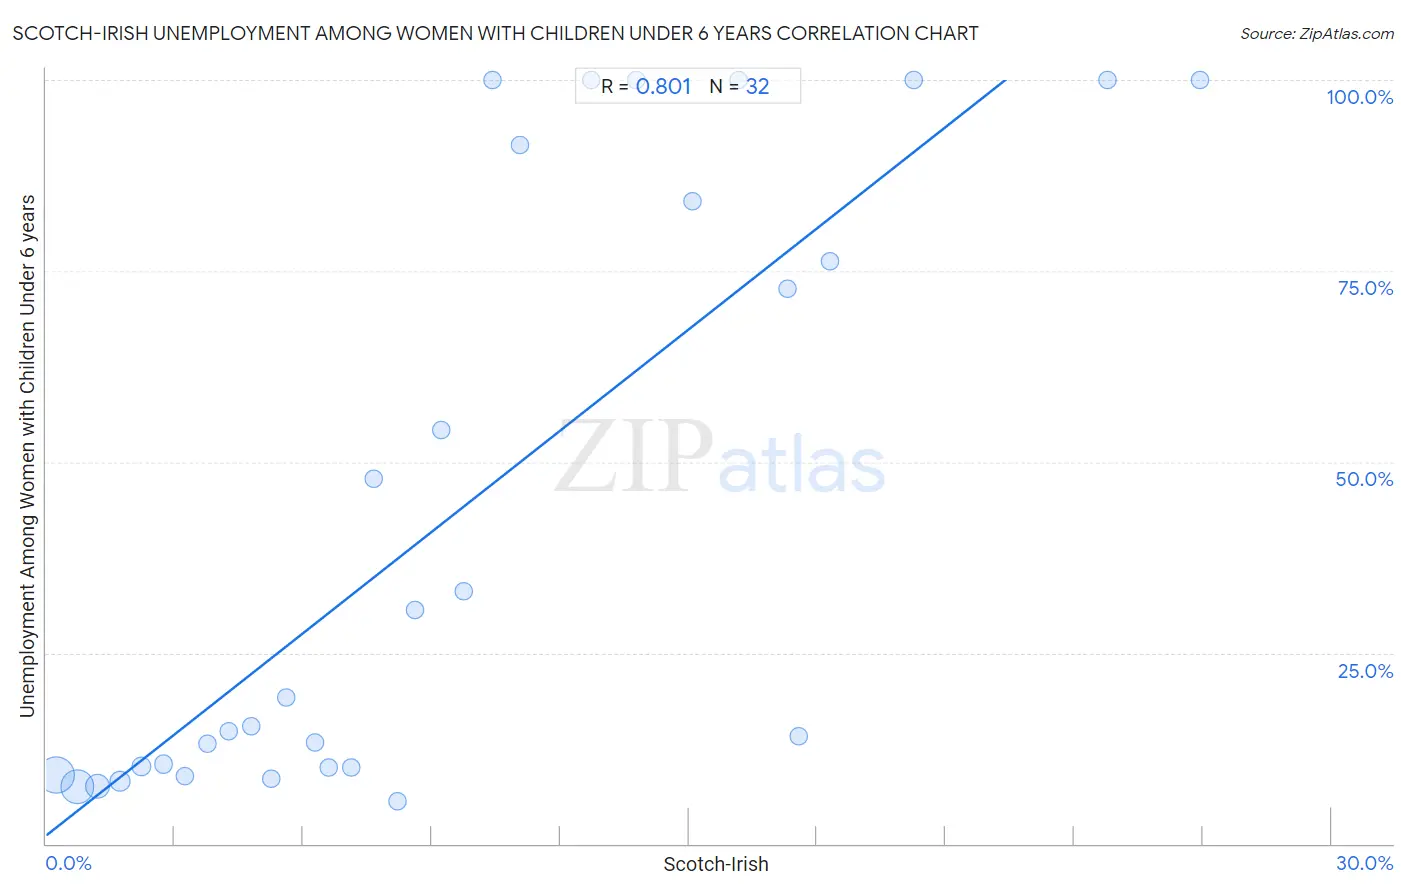
It is essential to understand that the correlation between the percentage of Scotch-Irish and unemployment rate among women with children under the age of 6 does not imply a direct cause-and-effect relationship. It remains uncertain whether the presence of Scotch-Irish influences an upward or downward trend in the level of unemployment rate among women with children under the age of 6 within an area, or if Scotch-Irish simply ended up residing in those areas with higher or lower levels of unemployment rate among women with children under the age of 6 due to other factors.

Demographics Similar to Scotch-Irish by Unemployment Among Women with Children Under 6 years

In terms of unemployment among women with children under 6 years, the demographic groups most similar to Scotch-Irish are Honduran (8.4%, a difference of 0.020%), West Indian (8.4%, a difference of 0.030%), Immigrants from Liberia (8.4%, a difference of 0.040%), French Canadian (8.4%, a difference of 0.070%), and Immigrants from Honduras (8.4%, a difference of 0.070%).
DemographicsRating | RankUnemployment Among Women with Children Under 6 years
Celtics
0.6
/100
|
#256
Tragic
8.3%
British West Indians
0.5
/100
|
#257
Tragic
8.3%
Immigrants from Ghana
0.5
/100
|
#258
Tragic
8.3%
Barbadians
0.4
/100
|
#259
Tragic
8.3%
Whites/Caucasians
0.3
/100
|
#260
Tragic
8.4%
Immigrants from Liberia
0.3
/100
|
#261
Tragic
8.4%
West Indians
0.3
/100
|
#262
Tragic
8.4%
Scotch-Irish
0.3
/100
|
#263
Tragic
8.4%
Hondurans
0.3
/100
|
#264
Tragic
8.4%
French Canadians
0.3
/100
|
#265
Tragic
8.4%
Immigrants from Honduras
0.3
/100
|
#266
Tragic
8.4%
Belizeans
0.2
/100
|
#267
Tragic
8.4%
Sub-Saharan Africans
0.2
/100
|
#268
Tragic
8.4%
Immigrants from Haiti
0.2
/100
|
#269
Tragic
8.4%
Immigrants from Senegal
0.2
/100
|
#270
Tragic
8.5%

Scotch-Irish Unemployment Among Women with Children Under 6 years Correlation Summary

MeasurementScotch-Irish DataUnemployment Among Women with Children Under 6 years Data
Minimum0.25%5.6%
Maximum26.9%100.0%
Range26.7%94.4%
Mean9.5%43.0%
Median7.9%17.2%
Interquartile 25% (IQ1)4.0%10.0%
Interquartile 75% (IQ3)14.4%87.8%
Interquartile Range (IQR)10.4%77.9%
Standard Deviation (Sample)7.0%38.9%
Standard Deviation (Population)6.9%38.3%

Correlation Details

Scotch-Irish PercentileSample SizeUnemployment Among Women with Children Under 6 years
[
0.0%
-
0.5%
]
0.25%
153,395,1978.9%
[
0.5%
-
1.0%
]
0.72%
125,351,4277.5%
[
1.0%
-
1.5%
]
1.20%
50,726,9917.5%
[
1.5%
-
2.0%
]
1.71%
20,191,4318.3%
[
2.0%
-
2.5%
]
2.22%
7,802,80410.1%
[
2.5%
-
3.0%
]
2.74%
3,844,16410.5%
[
3.0%
-
3.5%
]
3.23%
2,148,3048.9%
[
3.5%
-
4.0%
]
3.76%
1,057,54313.1%
[
4.0%
-
4.5%
]
4.26%
327,53314.7%
[
4.5%
-
5.0%
]
4.79%
108,80915.4%
[
5.0%
-
5.5%
]
5.26%
216,1258.6%
[
5.5%
-
6.0%
]
5.60%
38,07719.1%
[
6.0%
-
6.5%
]
6.28%
43,25113.3%
[
6.5%
-
7.0%
]
6.61%
13,0749.9%
[
7.0%
-
7.5%
]
7.12%
24,50810.0%
[
7.5%
-
8.0%
]
7.65%
10,65847.9%
[
8.0%
-
8.5%
]
8.21%
6,9295.6%
[
8.5%
-
9.0%
]
8.60%
13,45430.6%
[
9.0%
-
9.5%
]
9.23%
2,27454.1%
[
9.5%
-
10.0%
]
9.74%
6,36333.1%
[
10.0%
-
10.5%
]
10.42%
4,549100.0%
[
11.0%
-
11.5%
]
11.06%
4,99891.5%
[
12.5%
-
13.0%
]
12.73%
432100.0%
[
13.5%
-
14.0%
]
13.79%
4,178100.0%
[
15.0%
-
15.5%
]
15.09%
28584.2%
[
16.0%
-
16.5%
]
16.18%
377100.0%
[
17.0%
-
17.5%
]
17.30%
34172.7%
[
17.5%
-
18.0%
]
17.56%
4,57314.0%
[
18.0%
-
18.5%
]
18.30%
1,52576.3%
[
20.0%
-
20.5%
]
20.24%
247100.0%
[
24.5%
-
25.0%
]
24.79%
117100.0%
[
26.5%
-
27.0%
]
26.92%
364100.0%