Immigrants from North America Self-Care Disability

COMPARE

Immigrants from North America
Race
Ancestry
AfghanAfricanAlaska NativeAlaskan AthabascanAlbanianAleutAlsatianAmericanApacheArabArapahoArgentineanArmenianAssyrian/Chaldean/SyriacAustralianAustrianBahamianBangladeshiBarbadianBasqueBelgianBelizeanBermudanBhutaneseBlackfeetBolivianBrazilianBritishBritish West IndianBulgarianBurmeseCajunCambodianCanadianCape VerdeanCarpatho RusynCelticCentral AmericanCentral American IndianCherokeeCheyenneChickasawChileanChineseChippewaChoctawColombianColvilleComancheCosta RicanCreeCreekCroatianCrowCubanCypriotCzechCzechoslovakianDanishDelawareDominicanDutchDutch West IndianEastern EuropeanEcuadorianEgyptianEnglishEstonianEthiopianEuropeanFijianFilipinoFinnishFrenchFrench American IndianFrench CanadianGermanGerman RussianGhanaianGreekGuamanian/ChamorroGuatemalanGuyaneseHaitianHmongHonduranHopiHoumaHungarianIcelanderIndian (Asian)IndonesianInupiatIranianIraqiIrishIroquoisIsraeliItalianJamaicanJapaneseJordanianKenyanKiowaKoreanLaotianLatvianLebaneseLiberianLithuanianLumbeeLuxembourgerMacedonianMalaysianMalteseMarshalleseMenomineeMexicanMexican American IndianMongolianMoroccanNative HawaiianNavajoNepaleseNew ZealanderNicaraguanNigerianNorthern EuropeanNorwegianOkinawanOsageOttawaPaiutePakistaniPalestinianPanamanianParaguayanPennsylvania GermanPeruvianPimaPolishPortuguesePotawatomiPuebloPuerto RicanPuget Sound SalishRomanianRussianSalvadoranSamoanScandinavianScotch-IrishScottishSeminoleSenegaleseSerbianShoshoneSierra LeoneanSiouxSlavicSlovakSloveneSomaliSouth AfricanSouth AmericanSouth American IndianSoviet UnionSpaniardSpanishSpanish AmericanSpanish American IndianSri LankanSubsaharan AfricanSudaneseSwedishSwissSyrianTaiwaneseThaiTlingit-HaidaTohono O'OdhamTonganTrinidadian and TobagonianTsimshianTurkishU.S. Virgin IslanderUgandanUkrainianUruguayanUteVenezuelanVietnameseWelshWest IndianYakamaYaquiYugoslavianYumanYup'ikZimbabwean
Immigration
NonimmigrantsImmigrantsAfghanistanAfricaAlbaniaArgentinaArmeniaAsiaAustraliaAustriaBahamasBangladeshBarbadosBelarusBelgiumBelizeBoliviaBosnia and HerzegovinaBrazilBulgariaBurma/MyanmarCabo VerdeCambodiaCameroonCanadaCaribbeanCentral AmericaChileChinaColombiaCongoCosta RicaCroatiaCubaCzechoslovakiaDenmarkDominicaDominican RepublicEastern AfricaEastern AsiaEastern EuropeEcuadorEgyptEl SalvadorEnglandEritreaEthiopiaEuropeFijiFranceGermanyGhanaGreeceGrenadaGuatemalaGuyanaHaitiHondurasHong KongHungaryIndiaIndonesiaIranIraqIrelandIsraelItalyJamaicaJapanJordanKazakhstanKenyaKoreaKuwaitLaosLatin AmericaLatviaLebanonLiberiaLithuaniaMalaysiaMexicoMicronesiaMiddle AfricaMoldovaMoroccoNepalNetherlandsNicaraguaNigeriaNorth AmericaNorth MacedoniaNorthern AfricaNorthern EuropeNorwayOceaniaPakistanPanamaPeruPhilippinesPolandPortugalRomaniaRussiaSaudi ArabiaScotlandSenegalSerbiaSierra LeoneSingaporeSomaliaSouth AfricaSouth AmericaSouth Central AsiaSouth Eastern AsiaSouthern EuropeSpainSri LankaSt. Vincent and the GrenadinesSudanSwedenSwitzerlandSyriaTaiwanThailandTrinidad and TobagoTurkeyUgandaUkraineUruguayUzbekistanVenezuelaVietnamWest IndiesWestern AfricaWestern AsiaWestern EuropeYemenZaireZimbabweAzores
Select to Compare
Race
Ancestry
AfghanAfricanAlaska NativeAlaskan AthabascanAlbanianAleutAlsatianAmericanApacheArabArapahoArgentineanArmenianAssyrian/Chaldean/SyriacAustralianAustrianBahamianBangladeshiBarbadianBasqueBelgianBelizeanBermudanBhutaneseBlackfeetBolivianBrazilianBritishBritish West IndianBulgarianBurmeseCajunCambodianCanadianCape VerdeanCarpatho RusynCelticCentral AmericanCentral American IndianCherokeeCheyenneChickasawChileanChineseChippewaChoctawColombianColvilleComancheCosta RicanCreeCreekCroatianCrowCubanCypriotCzechCzechoslovakianDanishDelawareDominicanDutchDutch West IndianEastern EuropeanEcuadorianEgyptianEnglishEstonianEthiopianEuropeanFijianFilipinoFinnishFrenchFrench American IndianFrench CanadianGermanGerman RussianGhanaianGreekGuamanian/ChamorroGuatemalanGuyaneseHaitianHmongHonduranHopiHoumaHungarianIcelanderIndian (Asian)IndonesianInupiatIranianIraqiIrishIroquoisIsraeliItalianJamaicanJapaneseJordanianKenyanKiowaKoreanLaotianLatvianLebaneseLiberianLithuanianLumbeeLuxembourgerMacedonianMalaysianMalteseMarshalleseMenomineeMexicanMexican American IndianMongolianMoroccanNative HawaiianNavajoNepaleseNew ZealanderNicaraguanNigerianNorthern EuropeanNorwegianOkinawanOsageOttawaPaiutePakistaniPalestinianPanamanianParaguayanPennsylvania GermanPeruvianPimaPolishPortuguesePotawatomiPuebloPuerto RicanPuget Sound SalishRomanianRussianSalvadoranSamoanScandinavianScotch-IrishScottishSeminoleSenegaleseSerbianShoshoneSierra LeoneanSiouxSlavicSlovakSloveneSomaliSouth AfricanSouth AmericanSouth American IndianSoviet UnionSpaniardSpanishSpanish AmericanSpanish American IndianSri LankanSubsaharan AfricanSudaneseSwedishSwissSyrianTaiwaneseThaiTlingit-HaidaTohono O'OdhamTonganTrinidadian and TobagonianTsimshianTurkishU.S. Virgin IslanderUgandanUkrainianUruguayanUteVenezuelanVietnameseWelshWest IndianYakamaYaquiYugoslavianYumanYup'ikZimbabwean
Immigration
NonimmigrantsImmigrantsAfghanistanAfricaAlbaniaArgentinaArmeniaAsiaAustraliaAustriaBahamasBangladeshBarbadosBelarusBelgiumBelizeBoliviaBosnia and HerzegovinaBrazilBulgariaBurma/MyanmarCabo VerdeCambodiaCameroonCanadaCaribbeanCentral AmericaChileChinaColombiaCongoCosta RicaCroatiaCubaCzechoslovakiaDenmarkDominicaDominican RepublicEastern AfricaEastern AsiaEastern EuropeEcuadorEgyptEl SalvadorEnglandEritreaEthiopiaEuropeFijiFranceGermanyGhanaGreeceGrenadaGuatemalaGuyanaHaitiHondurasHong KongHungaryIndiaIndonesiaIranIraqIrelandIsraelItalyJamaicaJapanJordanKazakhstanKenyaKoreaKuwaitLaosLatin AmericaLatviaLebanonLiberiaLithuaniaMalaysiaMexicoMicronesiaMiddle AfricaMoldovaMoroccoNepalNetherlandsNicaraguaNigeriaNorth MacedoniaNorthern AfricaNorthern EuropeNorwayOceaniaPakistanPanamaPeruPhilippinesPolandPortugalRomaniaRussiaSaudi ArabiaScotlandSenegalSerbiaSierra LeoneSingaporeSomaliaSouth AfricaSouth AmericaSouth Central AsiaSouth Eastern AsiaSouthern EuropeSpainSri LankaSt. Vincent and the GrenadinesSudanSwedenSwitzerlandSyriaTaiwanThailandTrinidad and TobagoTurkeyUgandaUkraineUruguayUzbekistanVenezuelaVietnamWest IndiesWestern AfricaWestern AsiaWestern EuropeYemenZaireZimbabweAzores
Self-Care Disability
Income
Poverty
Unemployment
Labor Participation
Family Structure
Vehicle Availability
Education Level
Disability

Immigrants from North America Self-Care Disability
Exceptional

2.4%
SELF-CARE DISABILITY
90.2/ 100
METRIC RATING
124th/ 347
METRIC RANK

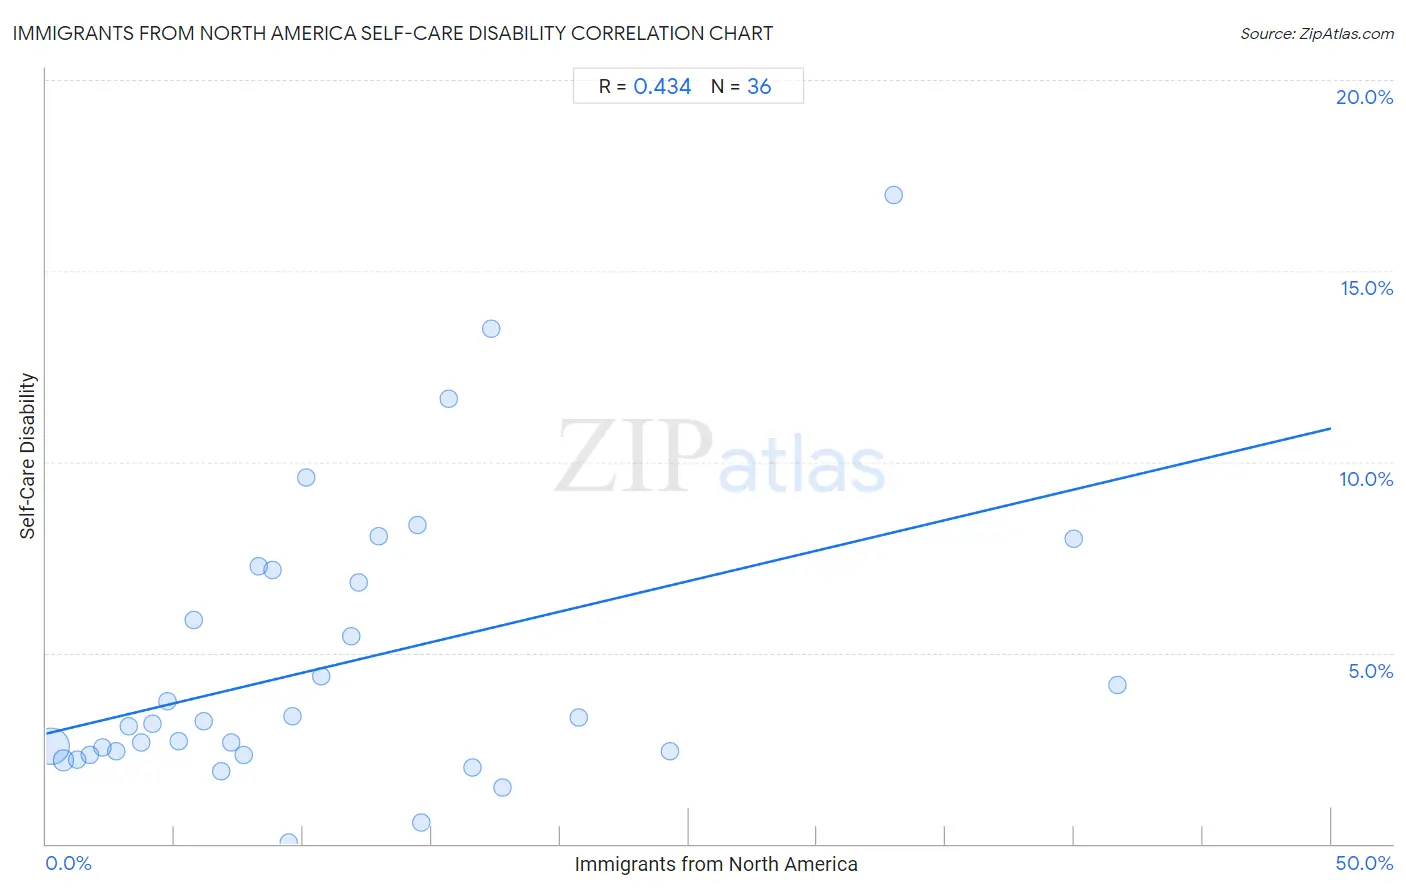
Immigrants from North America Self-Care Disability Correlation Chart

The statistical analysis conducted on geographies consisting of 461,724,382 people shows a moderate positive correlation between the proportion of Immigrants from North America and percentage of population with self-care disability in the United States with a correlation coefficient (R) of 0.434 and weighted average of 2.4%. On average, for every 1% (one percent) increase in Immigrants from North America within a typical geography, there is an increase of 0.16% in percentage of population with self-care disability.
Immigrants from North America Self-Care Disability
It is essential to understand that the correlation between the percentage of Immigrants from North America and percentage of population with self-care disability does not imply a direct cause-and-effect relationship. It remains uncertain whether the presence of Immigrants from North America influences an upward or downward trend in the level of percentage of population with self-care disability within an area, or if Immigrants from North America simply ended up residing in those areas with higher or lower levels of percentage of population with self-care disability due to other factors.

Demographics Similar to Immigrants from North America by Self-Care Disability

In terms of self-care disability, the demographic groups most similar to Immigrants from North America are Immigrants from Morocco (2.4%, a difference of 0.0%), Immigrants from Nigeria (2.4%, a difference of 0.010%), Hmong (2.4%, a difference of 0.040%), Colombian (2.4%, a difference of 0.070%), and Immigrants from Hungary (2.4%, a difference of 0.080%).
DemographicsRating | RankSelf-Care Disability
Taiwanese
92.5
/100
|
#117
Exceptional
2.4%
Immigrants from Canada
92.0
/100
|
#118
Exceptional
2.4%
Immigrants from Sierra Leone
91.8
/100
|
#119
Exceptional
2.4%
Uruguayans
91.5
/100
|
#120
Exceptional
2.4%
Peruvians
91.3
/100
|
#121
Exceptional
2.4%
Belgians
90.9
/100
|
#122
Exceptional
2.4%
Immigrants from Nigeria
90.3
/100
|
#123
Exceptional
2.4%
Immigrants from North America
90.2
/100
|
#124
Exceptional
2.4%
Immigrants from Morocco
90.2
/100
|
#124
Exceptional
2.4%
Hmong
89.9
/100
|
#126
Excellent
2.4%
Colombians
89.7
/100
|
#127
Excellent
2.4%
Immigrants from Hungary
89.6
/100
|
#128
Excellent
2.4%
Immigrants from Romania
89.3
/100
|
#129
Excellent
2.4%
Immigrants from Austria
89.0
/100
|
#130
Excellent
2.4%
Poles
88.9
/100
|
#131
Excellent
2.4%

Immigrants from North America Self-Care Disability Correlation Summary

MeasurementImmigrants from North America DataSelf-Care Disability Data
Minimum0.19%0.045%
Maximum41.7%17.0%
Range41.5%17.0%
Mean11.5%4.7%
Median9.1%3.2%
Interquartile 25% (IQ1)4.4%2.4%
Interquartile 75% (IQ3)15.1%7.0%
Interquartile Range (IQR)10.7%4.6%
Standard Deviation (Sample)10.1%3.7%
Standard Deviation (Population)10.0%3.7%

Correlation Details

Immigrants from North America PercentileSample SizeSelf-Care Disability
[
0.0%
-
0.5%
]
0.19%
379,441,0532.5%
[
0.5%
-
1.0%
]
0.68%
61,095,1982.2%
[
1.0%
-
1.5%
]
1.20%
13,741,6032.2%
[
1.5%
-
2.0%
]
1.70%
4,580,0062.3%
[
2.0%
-
2.5%
]
2.21%
1,488,6582.5%
[
2.5%
-
3.0%
]
2.72%
651,9512.4%
[
3.0%
-
3.5%
]
3.21%
190,3273.1%
[
3.5%
-
4.0%
]
3.68%
145,4332.7%
[
4.0%
-
4.5%
]
4.12%
149,0703.1%
[
4.5%
-
5.0%
]
4.70%
43,3383.7%
[
5.0%
-
5.5%
]
5.15%
44,4172.7%
[
5.5%
-
6.0%
]
5.76%
19,2595.9%
[
6.0%
-
6.5%
]
6.14%
32,2383.2%
[
6.5%
-
7.0%
]
6.82%
15,4481.9%
[
7.0%
-
7.5%
]
7.20%
32,3982.6%
[
7.5%
-
8.0%
]
7.67%
14,6482.3%
[
8.0%
-
8.5%
]
8.25%
1,8797.3%
[
8.5%
-
9.0%
]
8.82%
4,1067.2%
[
9.0%
-
9.5%
]
9.44%
6,7160.045%
[
9.5%
-
10.0%
]
9.57%
1,5473.3%
[
10.0%
-
10.5%
]
10.11%
2,2459.6%
[
10.5%
-
11.0%
]
10.69%
2,4134.4%
[
11.5%
-
12.0%
]
11.87%
4,9355.4%
[
12.0%
-
12.5%
]
12.18%
2,7266.8%
[
12.5%
-
13.0%
]
12.94%
3948.0%
[
14.0%
-
14.5%
]
14.46%
5678.3%
[
14.5%
-
15.0%
]
14.62%
3900.55%
[
15.5%
-
16.0%
]
15.65%
14711.7%
[
16.5%
-
17.0%
]
16.59%
4,2972.0%
[
17.0%
-
17.5%
]
17.29%
13313.5%
[
17.5%
-
18.0%
]
17.74%
3,6691.5%
[
20.5%
-
21.0%
]
20.70%
4013.3%
[
24.0%
-
24.5%
]
24.26%
2,4982.4%
[
33.0%
-
33.5%
]
33.00%
20017.0%
[
40.0%
-
40.5%
]
40.00%
508.0%
[
41.5%
-
42.0%
]
41.67%
244.2%