Scotch-Irish Family Households with Children
COMPARE
Scotch-Irish
Select to Compare
Family Households with Children
Scotch-Irish Family Households with Children
26.8%
FAMILY HOUSEHOLDS WITH CHILDREN
1.4/ 100
METRIC RATING
256th/ 347
METRIC RANK
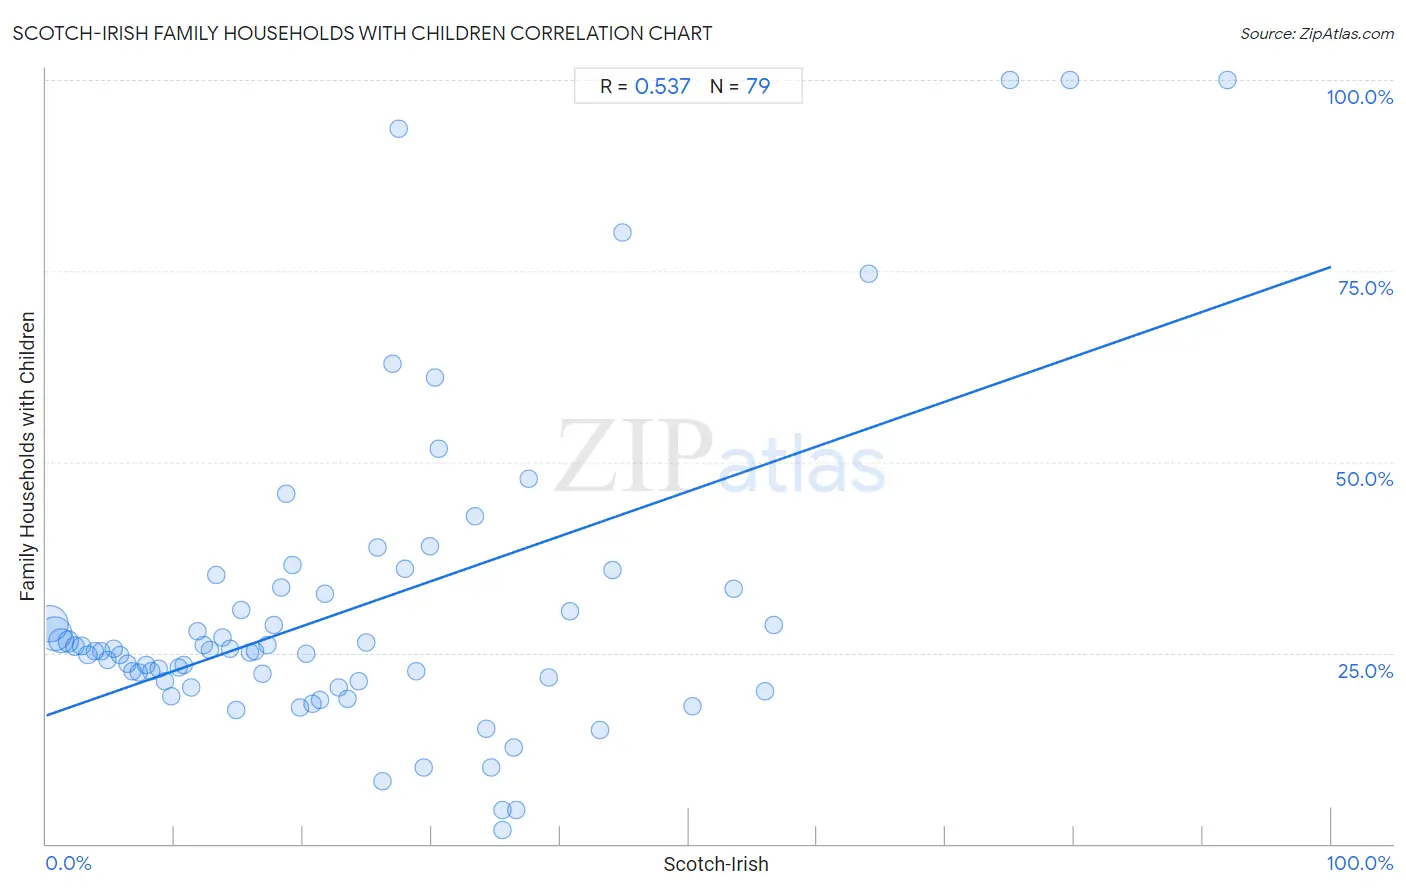
Scotch-Irish Family Households with Children Correlation Chart
The statistical analysis conducted on geographies consisting of 548,065,437 people shows a substantial positive correlation between the proportion of Scotch-Irish and percentage of family households with children in the United States with a correlation coefficient (R) of 0.537 and weighted average of 26.8%. On average, for every 1% (one percent) increase in Scotch-Irish within a typical geography, there is an increase of 0.59% in percentage of family households with children.
It is essential to understand that the correlation between the percentage of Scotch-Irish and percentage of family households with children does not imply a direct cause-and-effect relationship. It remains uncertain whether the presence of Scotch-Irish influences an upward or downward trend in the level of percentage of family households with children within an area, or if Scotch-Irish simply ended up residing in those areas with higher or lower levels of percentage of family households with children due to other factors.
Demographics Similar to Scotch-Irish by Family Households with Children
In terms of family households with children, the demographic groups most similar to Scotch-Irish are German Russian (26.8%, a difference of 0.010%), Immigrants from Scotland (26.8%, a difference of 0.020%), Italian (26.8%, a difference of 0.050%), Slavic (26.8%, a difference of 0.050%), and Immigrants from Cuba (26.8%, a difference of 0.050%).
| Demographics | Rating | Rank | Family Households with Children |
| Immigrants from Eastern Europe | 2.1 /100 | #249 | Tragic 26.9% |
| Belgians | 2.1 /100 | #250 | Tragic 26.9% |
| Immigrants from Bosnia and Herzegovina | 1.9 /100 | #251 | Tragic 26.8% |
| Irish | 1.8 /100 | #252 | Tragic 26.8% |
| Italians | 1.5 /100 | #253 | Tragic 26.8% |
| Immigrants from Scotland | 1.5 /100 | #254 | Tragic 26.8% |
| German Russians | 1.5 /100 | #255 | Tragic 26.8% |
| Scotch-Irish | 1.4 /100 | #256 | Tragic 26.8% |
| Slavs | 1.3 /100 | #257 | Tragic 26.8% |
| Immigrants from Cuba | 1.3 /100 | #258 | Tragic 26.8% |
| Immigrants from Lithuania | 1.2 /100 | #259 | Tragic 26.8% |
| Immigrants from Jamaica | 1.2 /100 | #260 | Tragic 26.8% |
| Immigrants from Belarus | 1.1 /100 | #261 | Tragic 26.8% |
| Immigrants from Russia | 1.0 /100 | #262 | Tragic 26.8% |
| Immigrants from North Macedonia | 1.0 /100 | #263 | Tragic 26.7% |
Scotch-Irish Family Households with Children Correlation Summary
| Measurement | Scotch-Irish Data | Family Households with Children Data |
| Minimum | 0.25% | 1.9% |
| Maximum | 91.9% | 100.0% |
| Range | 91.6% | 98.1% |
| Mean | 23.9% | 30.8% |
| Median | 19.7% | 25.3% |
| Interquartile 25% (IQ1) | 9.8% | 21.2% |
| Interquartile 75% (IQ3) | 34.3% | 33.3% |
| Interquartile Range (IQR) | 24.5% | 12.1% |
| Standard Deviation (Sample) | 18.9% | 20.6% |
| Standard Deviation (Population) | 18.7% | 20.5% |
Correlation Details
| Scotch-Irish Percentile | Sample Size | Family Households with Children |
[ 0.0% - 0.5% ] 0.25% | 210,523,963 | 28.8% |
[ 0.5% - 1.0% ] 0.72% | 183,125,879 | 27.5% |
[ 1.0% - 1.5% ] 1.21% | 82,633,679 | 26.6% |
[ 1.5% - 2.0% ] 1.72% | 36,421,491 | 26.5% |
[ 2.0% - 2.5% ] 2.21% | 15,895,816 | 25.8% |
[ 2.5% - 3.0% ] 2.73% | 7,857,472 | 25.9% |
[ 3.0% - 3.5% ] 3.23% | 5,129,679 | 24.8% |
[ 3.5% - 4.0% ] 3.75% | 2,455,692 | 25.2% |
[ 4.0% - 4.5% ] 4.25% | 1,270,096 | 25.3% |
[ 4.5% - 5.0% ] 4.76% | 747,452 | 24.1% |
[ 5.0% - 5.5% ] 5.23% | 641,239 | 25.5% |
[ 5.5% - 6.0% ] 5.71% | 325,654 | 24.8% |
[ 6.0% - 6.5% ] 6.29% | 208,698 | 23.6% |
[ 6.5% - 7.0% ] 6.71% | 138,736 | 22.6% |
[ 7.0% - 7.5% ] 7.23% | 120,348 | 22.4% |
[ 7.5% - 8.0% ] 7.79% | 112,134 | 23.4% |
[ 8.0% - 8.5% ] 8.22% | 75,619 | 22.6% |
[ 8.5% - 9.0% ] 8.75% | 60,406 | 22.9% |
[ 9.0% - 9.5% ] 9.27% | 36,890 | 21.3% |
[ 9.5% - 10.0% ] 9.76% | 38,674 | 19.4% |
[ 10.0% - 10.5% ] 10.27% | 38,588 | 23.0% |
[ 10.5% - 11.0% ] 10.69% | 26,807 | 23.5% |
[ 11.0% - 11.5% ] 11.24% | 19,745 | 20.4% |
[ 11.5% - 12.0% ] 11.80% | 17,607 | 27.8% |
[ 12.0% - 12.5% ] 12.23% | 9,043 | 26.0% |
[ 12.5% - 13.0% ] 12.76% | 4,907 | 25.3% |
[ 13.0% - 13.5% ] 13.22% | 18,996 | 35.1% |
[ 13.5% - 14.0% ] 13.71% | 16,687 | 27.0% |
[ 14.0% - 14.5% ] 14.25% | 15,813 | 25.5% |
[ 14.5% - 15.0% ] 14.83% | 3,466 | 17.5% |
[ 15.0% - 15.5% ] 15.17% | 6,078 | 30.6% |
[ 15.5% - 16.0% ] 15.86% | 5,271 | 25.0% |
[ 16.0% - 16.5% ] 16.20% | 11,201 | 25.2% |
[ 16.5% - 17.0% ] 16.81% | 5,163 | 22.2% |
[ 17.0% - 17.5% ] 17.26% | 8,044 | 26.0% |
[ 17.5% - 18.0% ] 17.66% | 9,659 | 28.6% |
[ 18.0% - 18.5% ] 18.30% | 2,164 | 33.5% |
[ 18.5% - 19.0% ] 18.65% | 2,917 | 45.9% |
[ 19.0% - 19.5% ] 19.18% | 1,314 | 36.5% |
[ 19.5% - 20.0% ] 19.72% | 1,136 | 17.9% |
[ 20.0% - 20.5% ] 20.24% | 499 | 24.8% |
[ 20.5% - 21.0% ] 20.74% | 2,931 | 18.3% |
[ 21.0% - 21.5% ] 21.27% | 945 | 18.8% |
[ 21.5% - 22.0% ] 21.72% | 1,372 | 32.7% |
[ 22.5% - 23.0% ] 22.75% | 1,156 | 20.4% |
[ 23.0% - 23.5% ] 23.42% | 1,029 | 19.0% |
[ 24.0% - 24.5% ] 24.34% | 226 | 21.2% |
[ 24.5% - 25.0% ] 24.87% | 1,773 | 26.3% |
[ 25.5% - 26.0% ] 25.79% | 570 | 38.9% |
[ 26.0% - 26.5% ] 26.19% | 168 | 8.3% |
[ 26.5% - 27.0% ] 26.92% | 364 | 62.9% |
[ 27.0% - 27.5% ] 27.43% | 175 | 93.5% |
[ 27.5% - 28.0% ] 27.93% | 179 | 36.0% |
[ 28.5% - 29.0% ] 28.77% | 212 | 22.6% |
[ 29.0% - 29.5% ] 29.42% | 469 | 10.0% |
[ 29.5% - 30.0% ] 29.91% | 662 | 38.9% |
[ 30.0% - 30.5% ] 30.26% | 2,991 | 61.0% |
[ 30.5% - 31.0% ] 30.57% | 386 | 51.7% |
[ 33.0% - 33.5% ] 33.33% | 36 | 42.9% |
[ 34.0% - 34.5% ] 34.26% | 683 | 15.0% |
[ 34.5% - 35.0% ] 34.59% | 185 | 10.0% |
[ 35.0% - 35.5% ] 35.46% | 141 | 4.4% |
[ 35.5% - 36.0% ] 35.54% | 166 | 1.9% |
[ 36.0% - 36.5% ] 36.40% | 728 | 12.6% |
[ 36.5% - 37.0% ] 36.53% | 605 | 4.4% |
[ 37.5% - 38.0% ] 37.58% | 157 | 47.8% |
[ 39.0% - 39.5% ] 39.08% | 87 | 21.7% |
[ 40.5% - 41.0% ] 40.78% | 103 | 30.4% |
[ 43.0% - 43.5% ] 43.13% | 473 | 15.0% |
[ 44.0% - 44.5% ] 44.08% | 338 | 35.9% |
[ 44.5% - 45.0% ] 44.84% | 339 | 80.0% |
[ 50.0% - 50.5% ] 50.34% | 149 | 18.0% |
[ 53.5% - 54.0% ] 53.51% | 299 | 33.3% |
[ 55.5% - 56.0% ] 55.93% | 59 | 20.0% |
[ 56.5% - 57.0% ] 56.63% | 83 | 28.6% |
[ 64.0% - 64.5% ] 64.00% | 175 | 74.7% |
[ 75.0% - 75.5% ] 75.00% | 20 | 100.0% |
[ 79.5% - 80.0% ] 79.66% | 59 | 100.0% |
[ 91.5% - 92.0% ] 91.89% | 222 | 100.0% |