Puget Sound Salish GED/Equivalency

COMPARE

Puget Sound Salish
Race
Ancestry
AfghanAfricanAlaska NativeAlaskan AthabascanAlbanianAleutAlsatianAmericanApacheArabArapahoArgentineanArmenianAssyrian/Chaldean/SyriacAustralianAustrianBahamianBangladeshiBarbadianBasqueBelgianBelizeanBermudanBhutaneseBlackfeetBolivianBrazilianBritishBritish West IndianBulgarianBurmeseCajunCambodianCanadianCape VerdeanCarpatho RusynCelticCentral AmericanCentral American IndianCherokeeCheyenneChickasawChileanChineseChippewaChoctawColombianColvilleComancheCosta RicanCreeCreekCroatianCrowCubanCypriotCzechCzechoslovakianDanishDelawareDominicanDutchDutch West IndianEastern EuropeanEcuadorianEgyptianEnglishEstonianEthiopianEuropeanFijianFilipinoFinnishFrenchFrench American IndianFrench CanadianGermanGerman RussianGhanaianGreekGuamanian/ChamorroGuatemalanGuyaneseHaitianHmongHonduranHopiHoumaHungarianIcelanderIndian (Asian)IndonesianInupiatIranianIraqiIrishIroquoisIsraeliItalianJamaicanJapaneseJordanianKenyanKiowaKoreanLaotianLatvianLebaneseLiberianLithuanianLumbeeLuxembourgerMacedonianMalaysianMalteseMarshalleseMenomineeMexicanMexican American IndianMongolianMoroccanNative HawaiianNavajoNepaleseNew ZealanderNicaraguanNigerianNorthern EuropeanNorwegianOkinawanOsageOttawaPaiutePakistaniPalestinianPanamanianParaguayanPennsylvania GermanPeruvianPimaPolishPortuguesePotawatomiPuebloPuerto RicanPuget Sound SalishRomanianRussianSalvadoranSamoanScandinavianScotch-IrishScottishSeminoleSenegaleseSerbianShoshoneSierra LeoneanSiouxSlavicSlovakSloveneSomaliSouth AfricanSouth AmericanSouth American IndianSoviet UnionSpaniardSpanishSpanish AmericanSpanish American IndianSri LankanSubsaharan AfricanSudaneseSwedishSwissSyrianTaiwaneseThaiTlingit-HaidaTohono O'OdhamTonganTrinidadian and TobagonianTsimshianTurkishU.S. Virgin IslanderUgandanUkrainianUruguayanUteVenezuelanVietnameseWelshWest IndianYakamaYaquiYugoslavianYumanYup'ikZimbabwean
Immigration
NonimmigrantsImmigrantsAfghanistanAfricaAlbaniaArgentinaArmeniaAsiaAustraliaAustriaBahamasBangladeshBarbadosBelarusBelgiumBelizeBoliviaBosnia and HerzegovinaBrazilBulgariaBurma/MyanmarCabo VerdeCambodiaCameroonCanadaCaribbeanCentral AmericaChileChinaColombiaCongoCosta RicaCroatiaCubaCzechoslovakiaDenmarkDominicaDominican RepublicEastern AfricaEastern AsiaEastern EuropeEcuadorEgyptEl SalvadorEnglandEritreaEthiopiaEuropeFijiFranceGermanyGhanaGreeceGrenadaGuatemalaGuyanaHaitiHondurasHong KongHungaryIndiaIndonesiaIranIraqIrelandIsraelItalyJamaicaJapanJordanKazakhstanKenyaKoreaKuwaitLaosLatin AmericaLatviaLebanonLiberiaLithuaniaMalaysiaMexicoMicronesiaMiddle AfricaMoldovaMoroccoNepalNetherlandsNicaraguaNigeriaNorth AmericaNorth MacedoniaNorthern AfricaNorthern EuropeNorwayOceaniaPakistanPanamaPeruPhilippinesPolandPortugalRomaniaRussiaSaudi ArabiaScotlandSenegalSerbiaSierra LeoneSingaporeSomaliaSouth AfricaSouth AmericaSouth Central AsiaSouth Eastern AsiaSouthern EuropeSpainSri LankaSt. Vincent and the GrenadinesSudanSwedenSwitzerlandSyriaTaiwanThailandTrinidad and TobagoTurkeyUgandaUkraineUruguayUzbekistanVenezuelaVietnamWest IndiesWestern AfricaWestern AsiaWestern EuropeYemenZaireZimbabweAzores
Select to Compare
Race
Ancestry
AfghanAfricanAlaska NativeAlaskan AthabascanAlbanianAleutAlsatianAmericanApacheArabArapahoArgentineanArmenianAssyrian/Chaldean/SyriacAustralianAustrianBahamianBangladeshiBarbadianBasqueBelgianBelizeanBermudanBhutaneseBlackfeetBolivianBrazilianBritishBritish West IndianBulgarianBurmeseCajunCambodianCanadianCape VerdeanCarpatho RusynCelticCentral AmericanCentral American IndianCherokeeCheyenneChickasawChileanChineseChippewaChoctawColombianColvilleComancheCosta RicanCreeCreekCroatianCrowCubanCypriotCzechCzechoslovakianDanishDelawareDominicanDutchDutch West IndianEastern EuropeanEcuadorianEgyptianEnglishEstonianEthiopianEuropeanFijianFilipinoFinnishFrenchFrench American IndianFrench CanadianGermanGerman RussianGhanaianGreekGuamanian/ChamorroGuatemalanGuyaneseHaitianHmongHonduranHopiHoumaHungarianIcelanderIndian (Asian)IndonesianInupiatIranianIraqiIrishIroquoisIsraeliItalianJamaicanJapaneseJordanianKenyanKiowaKoreanLaotianLatvianLebaneseLiberianLithuanianLumbeeLuxembourgerMacedonianMalaysianMalteseMarshalleseMenomineeMexicanMexican American IndianMongolianMoroccanNative HawaiianNavajoNepaleseNew ZealanderNicaraguanNigerianNorthern EuropeanNorwegianOkinawanOsageOttawaPaiutePakistaniPalestinianPanamanianParaguayanPennsylvania GermanPeruvianPimaPolishPortuguesePotawatomiPuebloPuerto RicanRomanianRussianSalvadoranSamoanScandinavianScotch-IrishScottishSeminoleSenegaleseSerbianShoshoneSierra LeoneanSiouxSlavicSlovakSloveneSomaliSouth AfricanSouth AmericanSouth American IndianSoviet UnionSpaniardSpanishSpanish AmericanSpanish American IndianSri LankanSubsaharan AfricanSudaneseSwedishSwissSyrianTaiwaneseThaiTlingit-HaidaTohono O'OdhamTonganTrinidadian and TobagonianTsimshianTurkishU.S. Virgin IslanderUgandanUkrainianUruguayanUteVenezuelanVietnameseWelshWest IndianYakamaYaquiYugoslavianYumanYup'ikZimbabwean
Immigration
NonimmigrantsImmigrantsAfghanistanAfricaAlbaniaArgentinaArmeniaAsiaAustraliaAustriaBahamasBangladeshBarbadosBelarusBelgiumBelizeBoliviaBosnia and HerzegovinaBrazilBulgariaBurma/MyanmarCabo VerdeCambodiaCameroonCanadaCaribbeanCentral AmericaChileChinaColombiaCongoCosta RicaCroatiaCubaCzechoslovakiaDenmarkDominicaDominican RepublicEastern AfricaEastern AsiaEastern EuropeEcuadorEgyptEl SalvadorEnglandEritreaEthiopiaEuropeFijiFranceGermanyGhanaGreeceGrenadaGuatemalaGuyanaHaitiHondurasHong KongHungaryIndiaIndonesiaIranIraqIrelandIsraelItalyJamaicaJapanJordanKazakhstanKenyaKoreaKuwaitLaosLatin AmericaLatviaLebanonLiberiaLithuaniaMalaysiaMexicoMicronesiaMiddle AfricaMoldovaMoroccoNepalNetherlandsNicaraguaNigeriaNorth AmericaNorth MacedoniaNorthern AfricaNorthern EuropeNorwayOceaniaPakistanPanamaPeruPhilippinesPolandPortugalRomaniaRussiaSaudi ArabiaScotlandSenegalSerbiaSierra LeoneSingaporeSomaliaSouth AfricaSouth AmericaSouth Central AsiaSouth Eastern AsiaSouthern EuropeSpainSri LankaSt. Vincent and the GrenadinesSudanSwedenSwitzerlandSyriaTaiwanThailandTrinidad and TobagoTurkeyUgandaUkraineUruguayUzbekistanVenezuelaVietnamWest IndiesWestern AfricaWestern AsiaWestern EuropeYemenZaireZimbabweAzores
GED/Equivalency
Income
Poverty
Unemployment
Labor Participation
Family Structure
Vehicle Availability
Education Level
Disability

Puget Sound Salish GED/Equivalency
Fair

85.2%
GED/EQUIVALENCY
20.8/ 100
METRIC RATING
194th/ 347
METRIC RANK

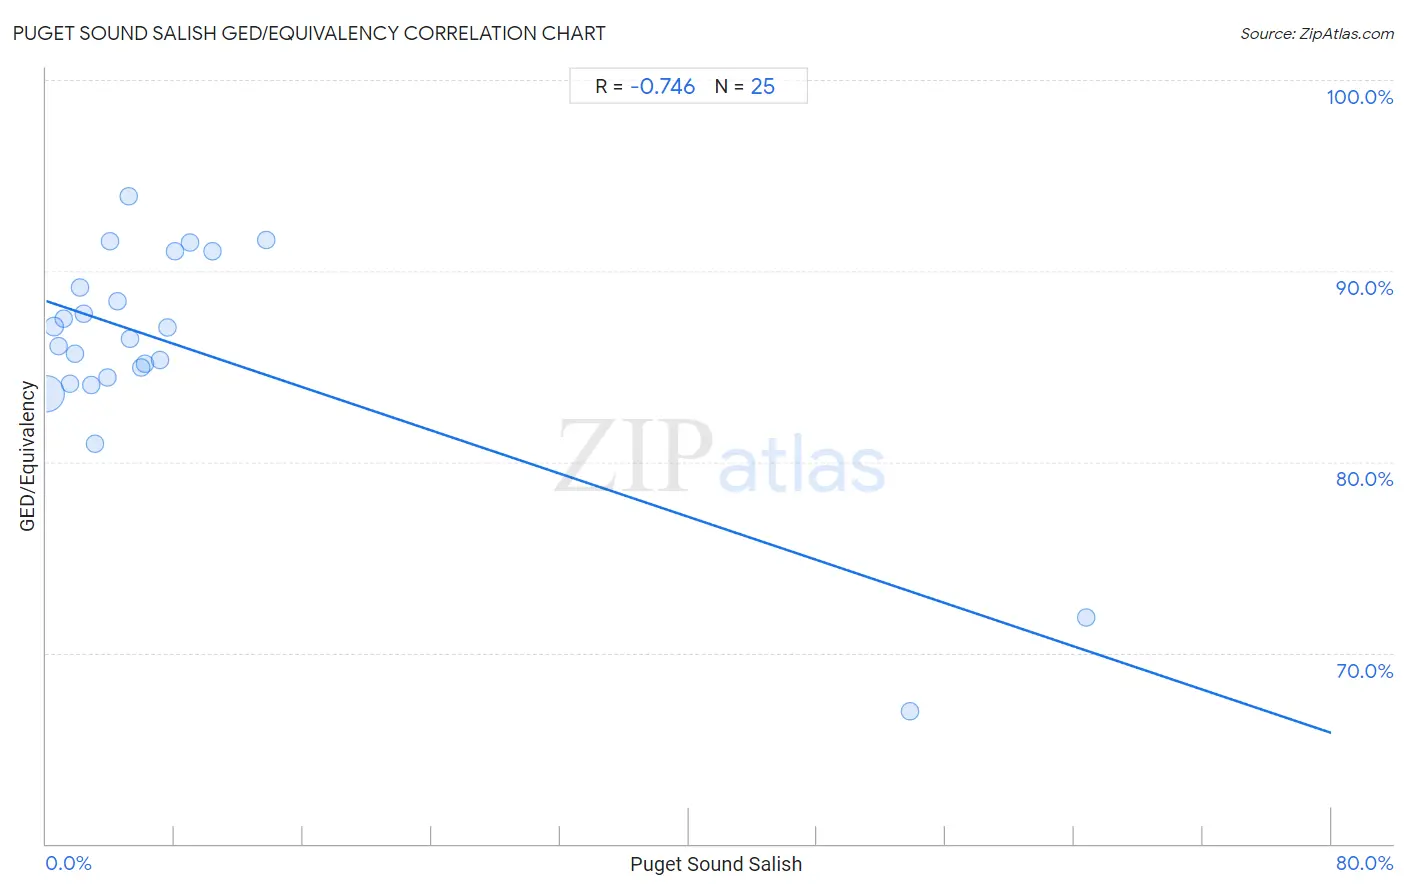
Puget Sound Salish GED/Equivalency Correlation Chart

The statistical analysis conducted on geographies consisting of 46,155,775 people shows a strong negative correlation between the proportion of Puget Sound Salish and percentage of population with at least ged/equivalency education in the United States with a correlation coefficient (R) of -0.746 and weighted average of 85.2%. On average, for every 1% (one percent) increase in Puget Sound Salish within a typical geography, there is a decrease of 0.28% in percentage of population with at least ged/equivalency education.
Puget Sound Salish GED/Equivalency
It is essential to understand that the correlation between the percentage of Puget Sound Salish and percentage of population with at least ged/equivalency education does not imply a direct cause-and-effect relationship. It remains uncertain whether the presence of Puget Sound Salish influences an upward or downward trend in the level of percentage of population with at least ged/equivalency education within an area, or if Puget Sound Salish simply ended up residing in those areas with higher or lower levels of percentage of population with at least ged/equivalency education due to other factors.

Demographics Similar to Puget Sound Salish by GED/Equivalency

In terms of ged/equivalency, the demographic groups most similar to Puget Sound Salish are Chippewa (85.2%, a difference of 0.0%), Tongan (85.2%, a difference of 0.0%), Costa Rican (85.2%, a difference of 0.010%), Delaware (85.2%, a difference of 0.040%), and South American Indian (85.2%, a difference of 0.060%).
DemographicsRating | RankGED/Equivalency
Immigrants from Afghanistan
29.8
/100
|
#187
Fair
85.4%
Immigrants from Sierra Leone
29.0
/100
|
#188
Fair
85.4%
Guamanians/Chamorros
28.4
/100
|
#189
Fair
85.3%
Alaskan Athabascans
27.5
/100
|
#190
Fair
85.3%
South American Indians
22.8
/100
|
#191
Fair
85.2%
Nonimmigrants
22.7
/100
|
#192
Fair
85.2%
Delaware
22.2
/100
|
#193
Fair
85.2%
Puget Sound Salish
20.8
/100
|
#194
Fair
85.2%
Chippewa
20.8
/100
|
#195
Fair
85.2%
Tongans
20.7
/100
|
#196
Fair
85.2%
Costa Ricans
20.4
/100
|
#197
Fair
85.2%
Immigrants from Africa
17.5
/100
|
#198
Poor
85.1%
Somalis
16.4
/100
|
#199
Poor
85.0%
Uruguayans
16.0
/100
|
#200
Poor
85.0%
Portuguese
15.9
/100
|
#201
Poor
85.0%

Puget Sound Salish GED/Equivalency Correlation Summary

MeasurementPuget Sound Salish DataGED/Equivalency Data
Minimum0.031%66.9%
Maximum64.8%93.9%
Range64.7%26.9%
Mean9.0%85.9%
Median4.4%86.5%
Interquartile 25% (IQ1)1.9%84.3%
Interquartile 75% (IQ3)7.8%90.1%
Interquartile Range (IQR)5.8%5.8%
Standard Deviation (Sample)15.6%5.9%
Standard Deviation (Population)15.3%5.8%

Correlation Details

Puget Sound Salish PercentileSample SizeGED/Equivalency
[
0.0%
-
0.5%
]
0.031%
43,380,40083.6%
[
0.0%
-
0.5%
]
0.48%
1,435,75087.1%
[
0.5%
-
1.0%
]
0.75%
629,73186.1%
[
1.0%
-
1.5%
]
1.07%
226,80487.5%
[
1.5%
-
2.0%
]
1.51%
123,81684.1%
[
1.5%
-
2.0%
]
1.81%
133,09585.6%
[
2.0%
-
2.5%
]
2.08%
67,84989.1%
[
2.0%
-
2.5%
]
2.35%
19,73387.8%
[
2.5%
-
3.0%
]
2.81%
37,06584.0%
[
3.0%
-
3.5%
]
3.03%
44,85080.9%
[
3.5%
-
4.0%
]
3.77%
2,04084.4%
[
3.5%
-
4.0%
]
3.95%
73491.6%
[
4.0%
-
4.5%
]
4.44%
2,18588.4%
[
5.0%
-
5.5%
]
5.14%
2,04193.9%
[
5.0%
-
5.5%
]
5.24%
1,41386.5%
[
5.5%
-
6.0%
]
5.91%
23785.0%
[
6.0%
-
6.5%
]
6.18%
3,28485.2%
[
7.0%
-
7.5%
]
7.09%
30,37685.3%
[
7.5%
-
8.0%
]
7.56%
11987.0%
[
8.0%
-
8.5%
]
8.00%
1,00091.0%
[
8.5%
-
9.0%
]
8.96%
3,20391.5%
[
10.0%
-
10.5%
]
10.33%
4,32991.0%
[
13.5%
-
14.0%
]
13.67%
4,48491.6%
[
53.5%
-
54.0%
]
53.79%
59366.9%
[
64.5%
-
65.0%
]
64.75%
64471.9%