Puget Sound Salish 4 or more Vehicles in Household
COMPARE
Puget Sound Salish
Select to Compare
4 or more Vehicles in Household
Puget Sound Salish 4 or more Vehicles in Household
9.4%
4+ VEHICLES AVAILABLE
100.0/ 100
METRIC RATING
6th/ 347
METRIC RANK
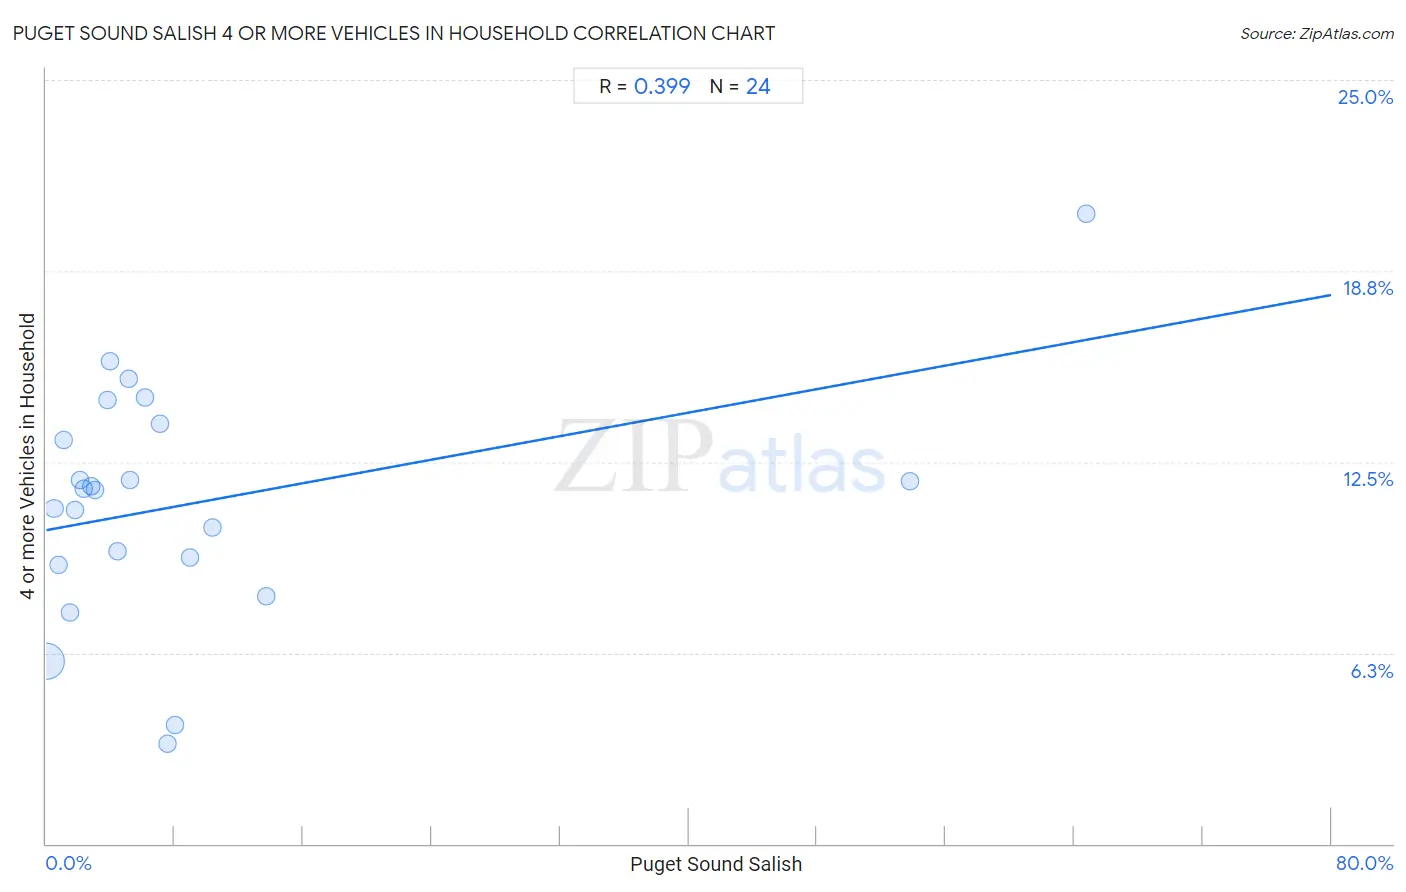
Puget Sound Salish 4 or more Vehicles in Household Correlation Chart
The statistical analysis conducted on geographies consisting of 46,139,594 people shows a mild positive correlation between the proportion of Puget Sound Salish and percentage of households with 4 or more vehicles available in the United States with a correlation coefficient (R) of 0.399 and weighted average of 9.4%. On average, for every 1% (one percent) increase in Puget Sound Salish within a typical geography, there is an increase of 0.096% in percentage of households with 4 or more vehicles available.
It is essential to understand that the correlation between the percentage of Puget Sound Salish and percentage of households with 4 or more vehicles available does not imply a direct cause-and-effect relationship. It remains uncertain whether the presence of Puget Sound Salish influences an upward or downward trend in the level of percentage of households with 4 or more vehicles available within an area, or if Puget Sound Salish simply ended up residing in those areas with higher or lower levels of percentage of households with 4 or more vehicles available due to other factors.
Demographics Similar to Puget Sound Salish by 4 or more Vehicles in Household
In terms of 4 or more vehicles in household, the demographic groups most similar to Puget Sound Salish are Native Hawaiian (9.4%, a difference of 0.020%), Arapaho (9.4%, a difference of 0.41%), Samoan (9.2%, a difference of 1.8%), Immigrants from Fiji (9.6%, a difference of 2.5%), and Paiute (9.0%, a difference of 4.2%).
| Demographics | Rating | Rank | 4 or more Vehicles in Household |
| Yakama | 100 /100 | #1 | Exceptional 12.9% |
| Colville | 100.0 /100 | #2 | Exceptional 11.1% |
| Spanish American Indians | 100.0 /100 | #3 | Exceptional 10.8% |
| Tongans | 100.0 /100 | #4 | Exceptional 10.0% |
| Immigrants from Fiji | 100.0 /100 | #5 | Exceptional 9.6% |
| Puget Sound Salish | 100.0 /100 | #6 | Exceptional 9.4% |
| Native Hawaiians | 100.0 /100 | #7 | Exceptional 9.4% |
| Arapaho | 100.0 /100 | #8 | Exceptional 9.4% |
| Samoans | 100.0 /100 | #9 | Exceptional 9.2% |
| Paiute | 100.0 /100 | #10 | Exceptional 9.0% |
| Immigrants from Mexico | 100.0 /100 | #11 | Exceptional 9.0% |
| Mexicans | 100.0 /100 | #12 | Exceptional 8.9% |
| Hawaiians | 100.0 /100 | #13 | Exceptional 8.9% |
| Chinese | 100.0 /100 | #14 | Exceptional 8.8% |
| Shoshone | 100.0 /100 | #15 | Exceptional 8.8% |
Puget Sound Salish 4 or more Vehicles in Household Correlation Summary
| Measurement | Puget Sound Salish Data | 4 or more Vehicles in Household Data |
| Minimum | 0.031% | 3.3% |
| Maximum | 64.8% | 20.6% |
| Range | 64.7% | 17.4% |
| Mean | 9.1% | 11.1% |
| Median | 4.2% | 11.6% |
| Interquartile 25% (IQ1) | 1.9% | 9.3% |
| Interquartile 75% (IQ3) | 7.8% | 13.5% |
| Interquartile Range (IQR) | 5.8% | 4.2% |
| Standard Deviation (Sample) | 15.9% | 3.8% |
| Standard Deviation (Population) | 15.6% | 3.8% |
Correlation Details
| Puget Sound Salish Percentile | Sample Size | 4 or more Vehicles in Household |
[ 0.0% - 0.5% ] 0.031% | 43,373,559 | 6.0% |
[ 0.0% - 0.5% ] 0.48% | 1,426,889 | 11.0% |
[ 0.5% - 1.0% ] 0.75% | 629,731 | 9.1% |
[ 1.0% - 1.5% ] 1.07% | 226,804 | 13.2% |
[ 1.5% - 2.0% ] 1.51% | 123,816 | 7.6% |
[ 1.5% - 2.0% ] 1.81% | 132,853 | 10.9% |
[ 2.0% - 2.5% ] 2.08% | 67,849 | 11.9% |
[ 2.0% - 2.5% ] 2.35% | 19,733 | 11.6% |
[ 2.5% - 3.0% ] 2.81% | 37,065 | 11.7% |
[ 3.0% - 3.5% ] 3.03% | 44,850 | 11.6% |
[ 3.5% - 4.0% ] 3.77% | 2,040 | 14.5% |
[ 3.5% - 4.0% ] 3.95% | 734 | 15.8% |
[ 4.0% - 4.5% ] 4.44% | 2,185 | 9.6% |
[ 5.0% - 5.5% ] 5.14% | 2,041 | 15.2% |
[ 5.0% - 5.5% ] 5.24% | 1,413 | 11.9% |
[ 6.0% - 6.5% ] 6.18% | 3,284 | 14.6% |
[ 7.0% - 7.5% ] 7.09% | 30,376 | 13.7% |
[ 7.5% - 8.0% ] 7.56% | 119 | 3.3% |
[ 8.0% - 8.5% ] 8.00% | 1,000 | 3.9% |
[ 8.5% - 9.0% ] 8.96% | 3,203 | 9.4% |
[ 10.0% - 10.5% ] 10.33% | 4,329 | 10.4% |
[ 13.5% - 14.0% ] 13.67% | 4,484 | 8.1% |
[ 53.5% - 54.0% ] 53.79% | 593 | 11.9% |
[ 64.5% - 65.0% ] 64.75% | 644 | 20.6% |