Potawatomi Male Disability
COMPARE
Potawatomi
Select to Compare
Male Disability
Potawatomi Male Disability
14.2%
DISABILITY | MALES
0.0/ 100
METRIC RATING
327th/ 347
METRIC RANK
Potawatomi Male Disability Correlation Chart
The statistical analysis conducted on geographies consisting of 117,764,083 people shows a poor negative correlation between the proportion of Potawatomi and percentage of males with a disability in the United States with a correlation coefficient (R) of -0.106 and weighted average of 14.2%. On average, for every 1% (one percent) increase in Potawatomi within a typical geography, there is a decrease of 0.082% in percentage of males with a disability.
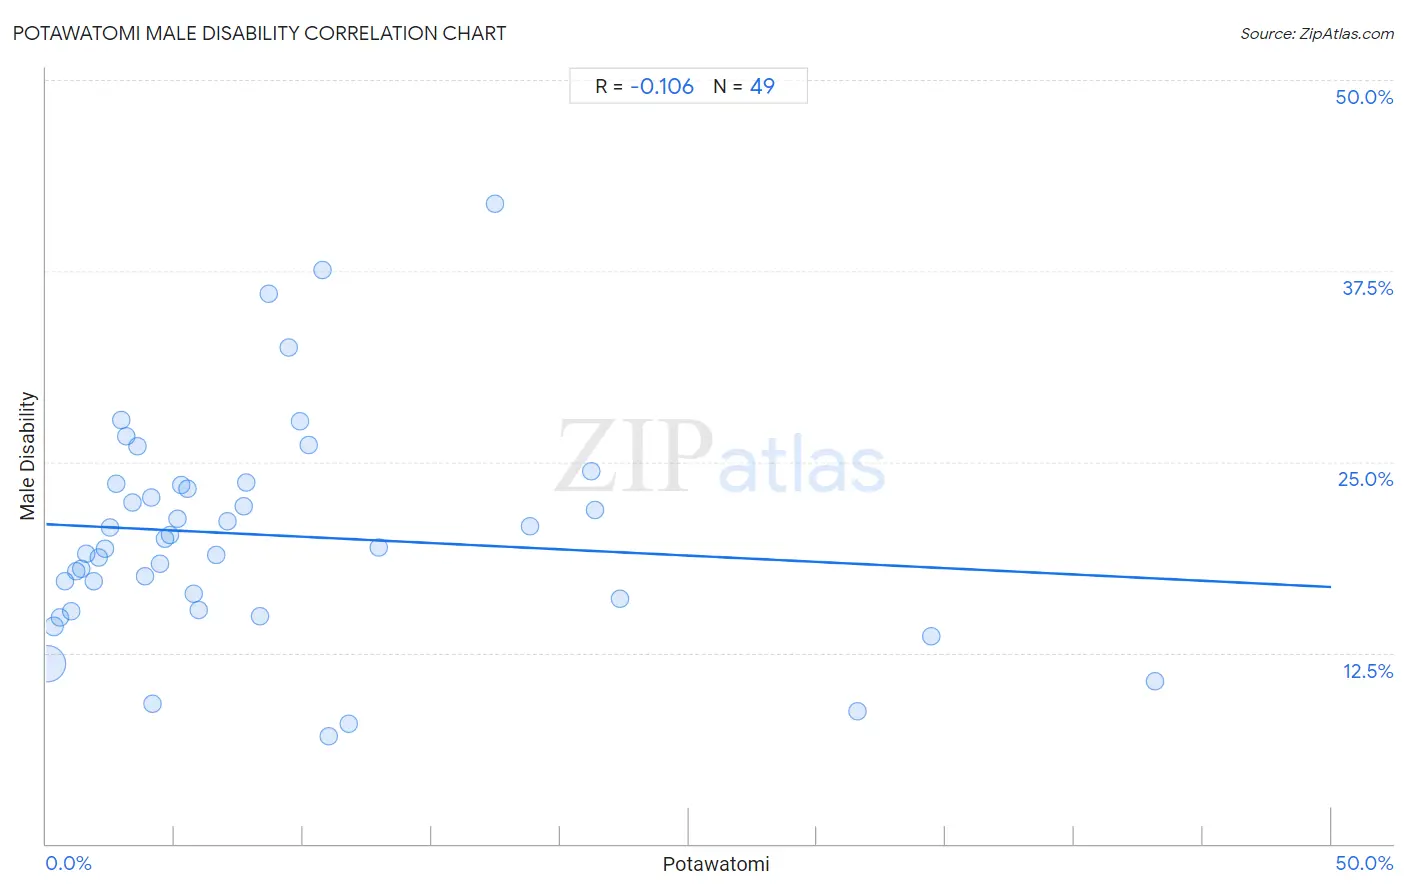
It is essential to understand that the correlation between the percentage of Potawatomi and percentage of males with a disability does not imply a direct cause-and-effect relationship. It remains uncertain whether the presence of Potawatomi influences an upward or downward trend in the level of percentage of males with a disability within an area, or if Potawatomi simply ended up residing in those areas with higher or lower levels of percentage of males with a disability due to other factors.
Demographics Similar to Potawatomi by Male Disability
In terms of male disability, the demographic groups most similar to Potawatomi are Native/Alaskan (14.2%, a difference of 0.10%), Chippewa (14.3%, a difference of 0.43%), Cajun (14.4%, a difference of 1.0%), Ottawa (14.1%, a difference of 1.1%), and Comanche (14.1%, a difference of 1.1%).
| Demographics | Rating | Rank | Male Disability |
| Tlingit-Haida | 0.0 /100 | #320 | Tragic 13.8% |
| Shoshone | 0.0 /100 | #321 | Tragic 13.8% |
| Apache | 0.0 /100 | #322 | Tragic 14.0% |
| Osage | 0.0 /100 | #323 | Tragic 14.0% |
| Comanche | 0.0 /100 | #324 | Tragic 14.1% |
| Ottawa | 0.0 /100 | #325 | Tragic 14.1% |
| Natives/Alaskans | 0.0 /100 | #326 | Tragic 14.2% |
| Potawatomi | 0.0 /100 | #327 | Tragic 14.2% |
| Chippewa | 0.0 /100 | #328 | Tragic 14.3% |
| Cajuns | 0.0 /100 | #329 | Tragic 14.4% |
| Navajo | 0.0 /100 | #330 | Tragic 14.4% |
| Tohono O'odham | 0.0 /100 | #331 | Tragic 14.6% |
| Seminole | 0.0 /100 | #332 | Tragic 14.7% |
| Yuman | 0.0 /100 | #333 | Tragic 14.7% |
| Cherokee | 0.0 /100 | #334 | Tragic 14.8% |
Potawatomi Male Disability Correlation Summary
| Measurement | Potawatomi Data | Male Disability Data |
| Minimum | 0.027% | 7.0% |
| Maximum | 43.2% | 41.9% |
| Range | 43.1% | 34.9% |
| Mean | 8.5% | 20.2% |
| Median | 5.2% | 19.4% |
| Interquartile 25% (IQ1) | 2.6% | 15.7% |
| Interquartile 75% (IQ3) | 10.5% | 23.5% |
| Interquartile Range (IQR) | 7.9% | 7.8% |
| Standard Deviation (Sample) | 9.2% | 7.2% |
| Standard Deviation (Population) | 9.1% | 7.1% |
Correlation Details
| Potawatomi Percentile | Sample Size | Male Disability |
[ 0.0% - 0.5% ] 0.027% | 110,251,787 | 11.8% |
[ 0.0% - 0.5% ] 0.29% | 5,317,396 | 14.2% |
[ 0.5% - 1.0% ] 0.53% | 1,024,893 | 14.8% |
[ 0.5% - 1.0% ] 0.73% | 402,433 | 17.2% |
[ 0.5% - 1.0% ] 0.95% | 315,758 | 15.2% |
[ 1.0% - 1.5% ] 1.17% | 92,346 | 17.8% |
[ 1.0% - 1.5% ] 1.37% | 64,289 | 18.0% |
[ 1.5% - 2.0% ] 1.57% | 64,395 | 19.0% |
[ 1.5% - 2.0% ] 1.86% | 30,276 | 17.1% |
[ 2.0% - 2.5% ] 2.04% | 51,110 | 18.7% |
[ 2.0% - 2.5% ] 2.26% | 26,288 | 19.3% |
[ 2.0% - 2.5% ] 2.47% | 47,216 | 20.7% |
[ 2.5% - 3.0% ] 2.71% | 8,626 | 23.5% |
[ 2.5% - 3.0% ] 2.94% | 7,007 | 27.7% |
[ 3.0% - 3.5% ] 3.13% | 4,923 | 26.7% |
[ 3.0% - 3.5% ] 3.37% | 4,689 | 22.4% |
[ 3.5% - 4.0% ] 3.55% | 2,957 | 26.1% |
[ 3.5% - 4.0% ] 3.84% | 1,692 | 17.5% |
[ 4.0% - 4.5% ] 4.08% | 147 | 22.7% |
[ 4.0% - 4.5% ] 4.15% | 3,494 | 9.1% |
[ 4.0% - 4.5% ] 4.41% | 2,132 | 18.4% |
[ 4.5% - 5.0% ] 4.62% | 8,745 | 19.9% |
[ 4.5% - 5.0% ] 4.83% | 5,757 | 20.3% |
[ 5.0% - 5.5% ] 5.08% | 118 | 21.3% |
[ 5.0% - 5.5% ] 5.24% | 2,081 | 23.5% |
[ 5.0% - 5.5% ] 5.50% | 4,948 | 23.2% |
[ 5.5% - 6.0% ] 5.73% | 994 | 16.3% |
[ 5.5% - 6.0% ] 5.95% | 4,572 | 15.3% |
[ 6.5% - 7.0% ] 6.61% | 772 | 18.9% |
[ 7.0% - 7.5% ] 7.06% | 2,607 | 21.1% |
[ 7.5% - 8.0% ] 7.69% | 221 | 22.1% |
[ 7.5% - 8.0% ] 7.80% | 346 | 23.7% |
[ 8.0% - 8.5% ] 8.33% | 240 | 14.9% |
[ 8.5% - 9.0% ] 8.67% | 773 | 36.0% |
[ 9.0% - 9.5% ] 9.43% | 244 | 32.5% |
[ 9.5% - 10.0% ] 9.86% | 487 | 27.7% |
[ 10.0% - 10.5% ] 10.20% | 49 | 26.1% |
[ 10.5% - 11.0% ] 10.73% | 382 | 37.6% |
[ 10.5% - 11.0% ] 10.99% | 182 | 7.0% |
[ 11.5% - 12.0% ] 11.76% | 136 | 7.9% |
[ 12.5% - 13.0% ] 12.93% | 495 | 19.4% |
[ 17.0% - 17.5% ] 17.48% | 143 | 41.9% |
[ 18.5% - 19.0% ] 18.85% | 2,462 | 20.8% |
[ 21.0% - 21.5% ] 21.23% | 1,404 | 24.4% |
[ 21.0% - 21.5% ] 21.37% | 117 | 21.9% |
[ 22.0% - 22.5% ] 22.33% | 1,702 | 16.1% |
[ 31.5% - 32.0% ] 31.58% | 38 | 8.7% |
[ 34.0% - 34.5% ] 34.45% | 119 | 13.6% |
[ 43.0% - 43.5% ] 43.16% | 95 | 10.6% |