Potawatomi Disability Age Under 5
COMPARE
Potawatomi
Select to Compare
Disability Age Under 5
Potawatomi Disability Age Under 5
1.4%
DISABILITY | AGE UNDER 5
1.1/ 100
METRIC RATING
245th/ 347
METRIC RANK
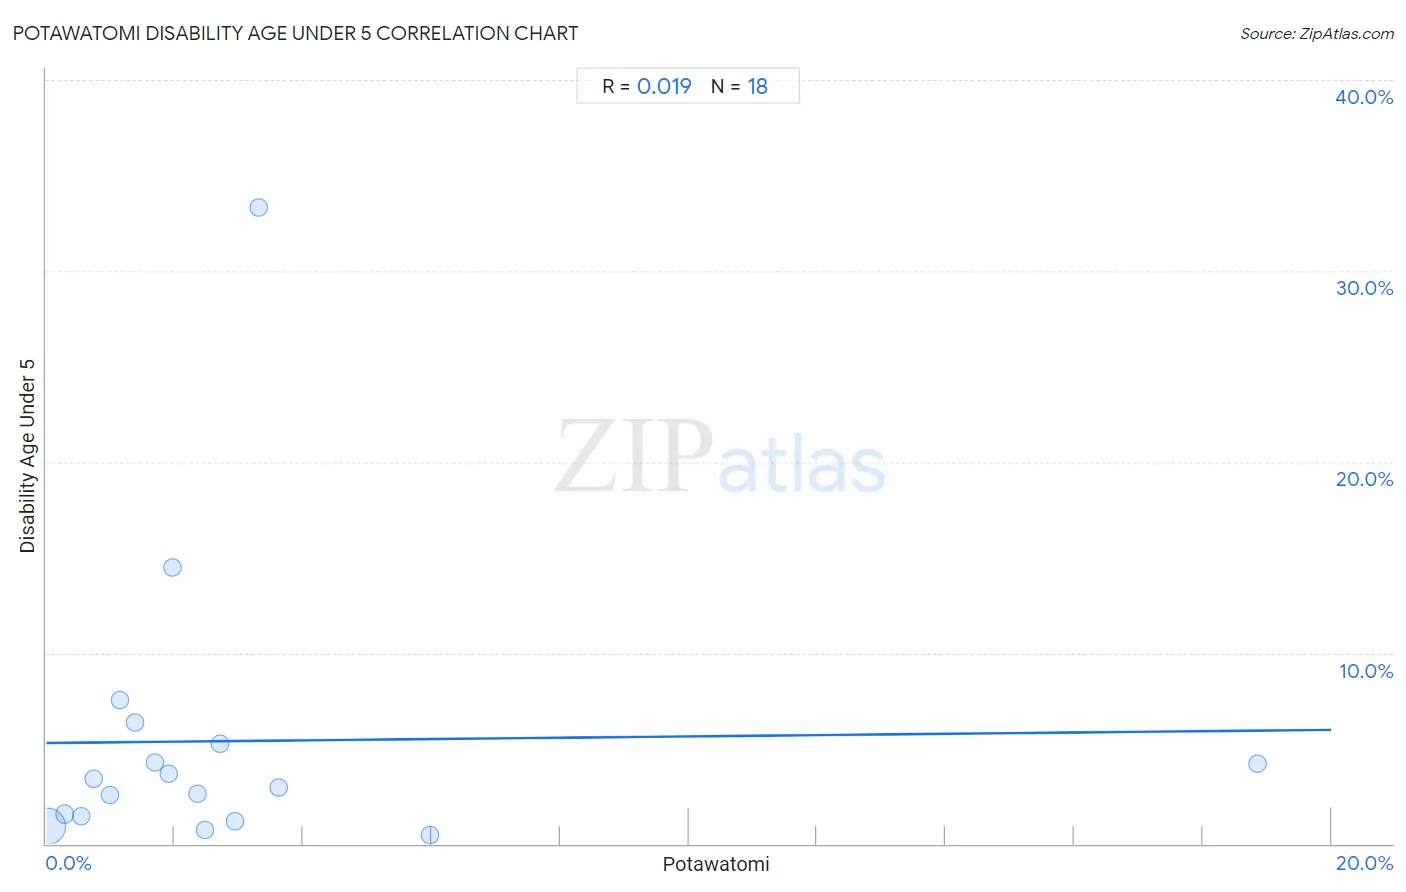
Potawatomi Disability Age Under 5 Correlation Chart
The statistical analysis conducted on geographies consisting of 88,888,283 people shows no correlation between the proportion of Potawatomi and percentage of population with a disability under the age of 5 in the United States with a correlation coefficient (R) of 0.019 and weighted average of 1.4%. On average, for every 1% (one percent) increase in Potawatomi within a typical geography, there is an increase of 0.034% in percentage of population with a disability under the age of 5.
It is essential to understand that the correlation between the percentage of Potawatomi and percentage of population with a disability under the age of 5 does not imply a direct cause-and-effect relationship. It remains uncertain whether the presence of Potawatomi influences an upward or downward trend in the level of percentage of population with a disability under the age of 5 within an area, or if Potawatomi simply ended up residing in those areas with higher or lower levels of percentage of population with a disability under the age of 5 due to other factors.
Demographics Similar to Potawatomi by Disability Age Under 5
In terms of disability age under 5, the demographic groups most similar to Potawatomi are Russian (1.4%, a difference of 0.13%), Immigrants from England (1.4%, a difference of 0.14%), Eastern European (1.4%, a difference of 0.17%), Bermudan (1.4%, a difference of 0.25%), and African (1.4%, a difference of 0.26%).
| Demographics | Rating | Rank | Disability Age Under 5 |
| Spanish American Indians | 2.4 /100 | #238 | Tragic 1.3% |
| Immigrants from Austria | 2.3 /100 | #239 | Tragic 1.3% |
| Native Hawaiians | 2.2 /100 | #240 | Tragic 1.3% |
| Maltese | 2.2 /100 | #241 | Tragic 1.3% |
| Lumbee | 2.1 /100 | #242 | Tragic 1.3% |
| Immigrants from Cameroon | 1.7 /100 | #243 | Tragic 1.4% |
| Spaniards | 1.4 /100 | #244 | Tragic 1.4% |
| Potawatomi | 1.1 /100 | #245 | Tragic 1.4% |
| Russians | 1.0 /100 | #246 | Tragic 1.4% |
| Immigrants from England | 1.0 /100 | #247 | Tragic 1.4% |
| Eastern Europeans | 1.0 /100 | #248 | Tragic 1.4% |
| Bermudans | 1.0 /100 | #249 | Tragic 1.4% |
| Africans | 1.0 /100 | #250 | Tragic 1.4% |
| Immigrants from Hungary | 1.0 /100 | #251 | Tragic 1.4% |
| Immigrants from Scotland | 0.9 /100 | #252 | Tragic 1.4% |
Potawatomi Disability Age Under 5 Correlation Summary
| Measurement | Potawatomi Data | Disability Age Under 5 Data |
| Minimum | 0.020% | 0.43% |
| Maximum | 18.8% | 33.3% |
| Range | 18.8% | 32.9% |
| Mean | 2.9% | 5.4% |
| Median | 1.9% | 3.2% |
| Interquartile 25% (IQ1) | 0.99% | 1.5% |
| Interquartile 75% (IQ3) | 2.9% | 5.3% |
| Interquartile Range (IQR) | 2.0% | 3.8% |
| Standard Deviation (Sample) | 4.2% | 7.7% |
| Standard Deviation (Population) | 4.1% | 7.5% |
Correlation Details
| Potawatomi Percentile | Sample Size | Disability Age Under 5 |
[ 0.0% - 0.5% ] 0.020% | 85,399,150 | 0.89% |
[ 0.0% - 0.5% ] 0.29% | 3,020,436 | 1.5% |
[ 0.5% - 1.0% ] 0.55% | 265,025 | 1.5% |
[ 0.5% - 1.0% ] 0.75% | 39,793 | 3.4% |
[ 0.5% - 1.0% ] 0.99% | 55,650 | 2.5% |
[ 1.0% - 1.5% ] 1.15% | 18,967 | 7.5% |
[ 1.0% - 1.5% ] 1.38% | 16,544 | 6.3% |
[ 1.5% - 2.0% ] 1.70% | 1,117 | 4.3% |
[ 1.5% - 2.0% ] 1.90% | 14,123 | 3.7% |
[ 1.5% - 2.0% ] 1.96% | 3,009 | 14.5% |
[ 2.0% - 2.5% ] 2.35% | 3,066 | 2.6% |
[ 2.0% - 2.5% ] 2.47% | 33,206 | 0.70% |
[ 2.5% - 3.0% ] 2.71% | 4,874 | 5.3% |
[ 2.5% - 3.0% ] 2.94% | 6,326 | 1.2% |
[ 3.0% - 3.5% ] 3.31% | 121 | 33.3% |
[ 3.5% - 4.0% ] 3.62% | 525 | 2.9% |
[ 5.5% - 6.0% ] 5.97% | 3,889 | 0.43% |
[ 18.5% - 19.0% ] 18.85% | 2,462 | 4.2% |