Navajo 3 or more Vehicles in Household
COMPARE
Navajo
Select to Compare
3 or more Vehicles in Household
Navajo 3 or more Vehicles in Household
22.3%
3+ VEHICLES AVAILABLE
100.0/ 100
METRIC RATING
59th/ 347
METRIC RANK
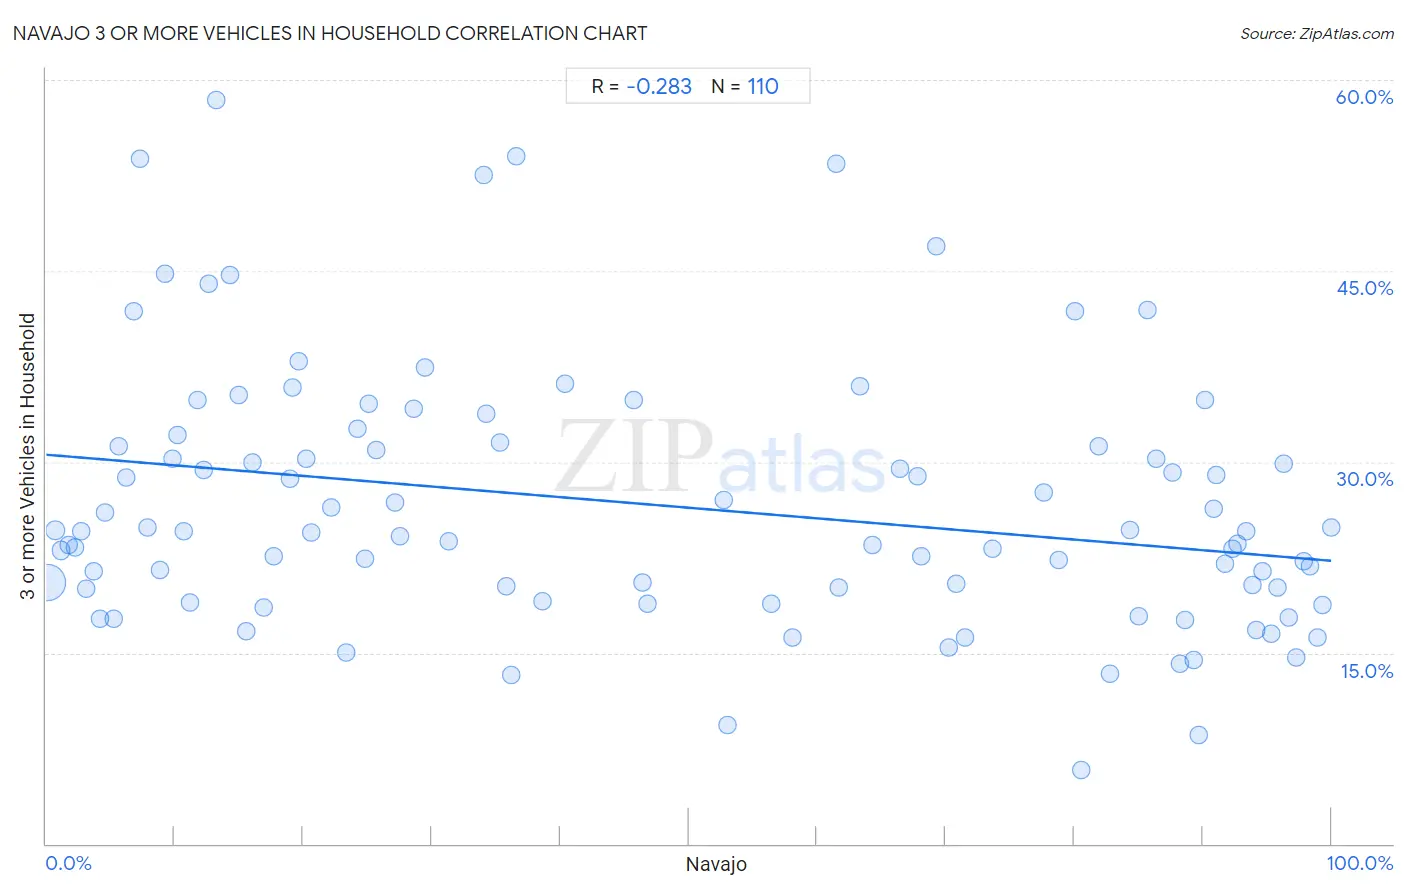
Navajo 3 or more Vehicles in Household Correlation Chart
The statistical analysis conducted on geographies consisting of 224,733,620 people shows a weak negative correlation between the proportion of Navajo and percentage of households with 3 or more vehicles available in the United States with a correlation coefficient (R) of -0.283 and weighted average of 22.3%. On average, for every 1% (one percent) increase in Navajo within a typical geography, there is a decrease of 0.083% in percentage of households with 3 or more vehicles available.
It is essential to understand that the correlation between the percentage of Navajo and percentage of households with 3 or more vehicles available does not imply a direct cause-and-effect relationship. It remains uncertain whether the presence of Navajo influences an upward or downward trend in the level of percentage of households with 3 or more vehicles available within an area, or if Navajo simply ended up residing in those areas with higher or lower levels of percentage of households with 3 or more vehicles available due to other factors.
Demographics Similar to Navajo by 3 or more Vehicles in Household
In terms of 3 or more vehicles in household, the demographic groups most similar to Navajo are Spaniard (22.3%, a difference of 0.060%), Finnish (22.3%, a difference of 0.090%), Pennsylvania German (22.3%, a difference of 0.19%), Bhutanese (22.2%, a difference of 0.24%), and Fijian (22.2%, a difference of 0.28%).
| Demographics | Rating | Rank | 3 or more Vehicles in Household |
| Welsh | 100.0 /100 | #52 | Exceptional 22.6% |
| Czechs | 100.0 /100 | #53 | Exceptional 22.5% |
| Crow | 100.0 /100 | #54 | Exceptional 22.5% |
| Immigrants from Laos | 100.0 /100 | #55 | Exceptional 22.4% |
| Hispanics or Latinos | 100.0 /100 | #56 | Exceptional 22.4% |
| Pennsylvania Germans | 100.0 /100 | #57 | Exceptional 22.3% |
| Spaniards | 100.0 /100 | #58 | Exceptional 22.3% |
| Navajo | 100.0 /100 | #59 | Exceptional 22.3% |
| Finns | 99.9 /100 | #60 | Exceptional 22.3% |
| Bhutanese | 99.9 /100 | #61 | Exceptional 22.2% |
| Fijians | 99.9 /100 | #62 | Exceptional 22.2% |
| Chickasaw | 99.9 /100 | #63 | Exceptional 22.2% |
| Immigrants from Taiwan | 99.9 /100 | #64 | Exceptional 22.1% |
| Pima | 99.9 /100 | #65 | Exceptional 22.0% |
| Northern Europeans | 99.9 /100 | #66 | Exceptional 22.0% |
Navajo 3 or more Vehicles in Household Correlation Summary
| Measurement | Navajo Data | 3 or more Vehicles in Household Data |
| Minimum | 0.078% | 5.8% |
| Maximum | 100.0% | 58.5% |
| Range | 99.9% | 52.7% |
| Mean | 48.0% | 26.6% |
| Median | 39.5% | 24.5% |
| Interquartile 25% (IQ1) | 15.0% | 20.0% |
| Interquartile 75% (IQ3) | 85.0% | 31.2% |
| Interquartile Range (IQR) | 70.0% | 11.2% |
| Standard Deviation (Sample) | 34.7% | 10.2% |
| Standard Deviation (Population) | 34.5% | 10.1% |
Correlation Details
| Navajo Percentile | Sample Size | 3 or more Vehicles in Household |
[ 0.0% - 0.5% ] 0.078% | 208,954,639 | 20.5% |
[ 0.5% - 1.0% ] 0.71% | 7,625,454 | 24.6% |
[ 1.0% - 1.5% ] 1.15% | 4,171,558 | 23.0% |
[ 1.5% - 2.0% ] 1.73% | 987,315 | 23.5% |
[ 2.0% - 2.5% ] 2.23% | 654,533 | 23.3% |
[ 2.5% - 3.0% ] 2.69% | 288,217 | 24.6% |
[ 3.0% - 3.5% ] 3.12% | 772,632 | 20.0% |
[ 3.5% - 4.0% ] 3.73% | 160,348 | 21.4% |
[ 4.0% - 4.5% ] 4.21% | 104,151 | 17.7% |
[ 4.5% - 5.0% ] 4.56% | 39,315 | 26.1% |
[ 5.0% - 5.5% ] 5.22% | 97,485 | 17.7% |
[ 5.5% - 6.0% ] 5.68% | 31,067 | 31.2% |
[ 6.0% - 6.5% ] 6.25% | 10,831 | 28.8% |
[ 6.5% - 7.0% ] 6.76% | 9,108 | 41.8% |
[ 7.0% - 7.5% ] 7.31% | 7,030 | 53.8% |
[ 7.5% - 8.0% ] 7.86% | 40,609 | 24.8% |
[ 8.5% - 9.0% ] 8.82% | 134,397 | 21.5% |
[ 9.0% - 9.5% ] 9.28% | 4,858 | 44.7% |
[ 9.5% - 10.0% ] 9.81% | 19,204 | 30.2% |
[ 10.0% - 10.5% ] 10.24% | 50,066 | 32.1% |
[ 10.5% - 11.0% ] 10.71% | 1,858 | 24.5% |
[ 11.0% - 11.5% ] 11.21% | 9,287 | 18.9% |
[ 11.5% - 12.0% ] 11.73% | 452 | 34.9% |
[ 12.0% - 12.5% ] 12.28% | 14,241 | 29.3% |
[ 12.5% - 13.0% ] 12.66% | 2,440 | 44.0% |
[ 13.0% - 13.5% ] 13.24% | 3,921 | 58.5% |
[ 14.0% - 14.5% ] 14.29% | 217 | 44.7% |
[ 15.0% - 15.5% ] 15.00% | 60 | 35.3% |
[ 15.5% - 16.0% ] 15.61% | 6,214 | 16.7% |
[ 16.0% - 16.5% ] 16.03% | 343 | 29.9% |
[ 16.5% - 17.0% ] 16.88% | 1,321 | 18.5% |
[ 17.5% - 18.0% ] 17.71% | 655 | 22.6% |
[ 18.5% - 19.0% ] 18.93% | 7,038 | 28.6% |
[ 19.0% - 19.5% ] 19.17% | 3,229 | 35.9% |
[ 19.5% - 20.0% ] 19.69% | 3,591 | 37.9% |
[ 20.0% - 20.5% ] 20.21% | 11,199 | 30.2% |
[ 20.5% - 21.0% ] 20.59% | 1,093 | 24.5% |
[ 22.0% - 22.5% ] 22.14% | 15,106 | 26.4% |
[ 23.0% - 23.5% ] 23.33% | 583 | 15.1% |
[ 24.0% - 24.5% ] 24.25% | 3,345 | 32.6% |
[ 24.5% - 25.0% ] 24.84% | 7,898 | 22.4% |
[ 25.0% - 25.5% ] 25.12% | 3,308 | 34.5% |
[ 25.5% - 26.0% ] 25.63% | 749 | 30.9% |
[ 27.0% - 27.5% ] 27.16% | 4,834 | 26.8% |
[ 27.5% - 28.0% ] 27.52% | 46,457 | 24.1% |
[ 28.5% - 29.0% ] 28.57% | 4,858 | 34.2% |
[ 29.0% - 29.5% ] 29.44% | 394 | 37.4% |
[ 31.0% - 31.5% ] 31.29% | 46,398 | 23.8% |
[ 34.0% - 34.5% ] 34.00% | 100 | 52.5% |
[ 34.0% - 34.5% ] 34.25% | 5,317 | 33.8% |
[ 35.0% - 35.5% ] 35.30% | 4,842 | 31.5% |
[ 35.5% - 36.0% ] 35.82% | 9,066 | 20.2% |
[ 36.0% - 36.5% ] 36.17% | 188 | 13.2% |
[ 36.5% - 37.0% ] 36.54% | 728 | 54.0% |
[ 38.5% - 39.0% ] 38.63% | 1,504 | 19.1% |
[ 40.0% - 40.5% ] 40.35% | 456 | 36.1% |
[ 45.5% - 46.0% ] 45.72% | 9,175 | 34.8% |
[ 46.0% - 46.5% ] 46.36% | 22,997 | 20.6% |
[ 46.5% - 47.0% ] 46.82% | 22,666 | 18.9% |
[ 52.5% - 53.0% ] 52.68% | 16,651 | 27.0% |
[ 53.0% - 53.5% ] 53.06% | 98 | 9.3% |
[ 56.0% - 56.5% ] 56.43% | 8,855 | 18.9% |
[ 58.0% - 58.5% ] 58.03% | 193 | 16.2% |
[ 61.0% - 61.5% ] 61.48% | 610 | 53.4% |
[ 61.5% - 62.0% ] 61.69% | 2,665 | 20.2% |
[ 63.0% - 63.5% ] 63.33% | 1,489 | 35.9% |
[ 64.0% - 64.5% ] 64.27% | 10,785 | 23.4% |
[ 66.0% - 66.5% ] 66.44% | 1,612 | 29.4% |
[ 67.5% - 68.0% ] 67.80% | 1,938 | 28.9% |
[ 68.0% - 68.5% ] 68.13% | 5,600 | 22.6% |
[ 69.0% - 69.5% ] 69.30% | 316 | 47.0% |
[ 70.0% - 70.5% ] 70.24% | 1,482 | 15.4% |
[ 70.5% - 71.0% ] 70.81% | 1,552 | 20.4% |
[ 71.0% - 71.5% ] 71.50% | 1,607 | 16.2% |
[ 73.5% - 74.0% ] 73.68% | 494 | 23.2% |
[ 77.5% - 78.0% ] 77.65% | 4,345 | 27.6% |
[ 78.5% - 79.0% ] 78.78% | 11,541 | 22.3% |
[ 80.0% - 80.5% ] 80.04% | 526 | 41.9% |
[ 80.5% - 81.0% ] 80.57% | 211 | 5.8% |
[ 81.5% - 82.0% ] 81.91% | 1,039 | 31.2% |
[ 82.5% - 83.0% ] 82.74% | 2,653 | 13.3% |
[ 84.0% - 84.5% ] 84.30% | 8,372 | 24.6% |
[ 85.0% - 85.5% ] 85.03% | 2,945 | 17.9% |
[ 85.5% - 86.0% ] 85.71% | 238 | 41.9% |
[ 86.0% - 86.5% ] 86.35% | 1,311 | 30.2% |
[ 87.5% - 88.0% ] 87.61% | 1,009 | 29.2% |
[ 88.0% - 88.5% ] 88.28% | 435 | 14.2% |
[ 88.5% - 89.0% ] 88.61% | 7,409 | 17.6% |
[ 89.0% - 89.5% ] 89.34% | 722 | 14.4% |
[ 89.5% - 90.0% ] 89.73% | 867 | 8.5% |
[ 90.0% - 90.5% ] 90.22% | 2,137 | 34.8% |
[ 90.5% - 91.0% ] 90.84% | 11,403 | 26.3% |
[ 91.0% - 91.5% ] 91.07% | 9,234 | 28.9% |
[ 91.5% - 92.0% ] 91.69% | 8,424 | 22.0% |
[ 92.0% - 92.5% ] 92.32% | 8,411 | 23.1% |
[ 92.5% - 93.0% ] 92.75% | 19,851 | 23.5% |
[ 93.0% - 93.5% ] 93.34% | 3,932 | 24.6% |
[ 93.5% - 94.0% ] 93.92% | 8,846 | 20.4% |
[ 94.0% - 94.5% ] 94.20% | 27,550 | 16.8% |
[ 94.5% - 95.0% ] 94.66% | 6,329 | 21.4% |
[ 95.0% - 95.5% ] 95.36% | 13,953 | 16.5% |
[ 95.5% - 96.0% ] 95.81% | 9,553 | 20.2% |
[ 96.0% - 96.5% ] 96.30% | 6,750 | 29.9% |
[ 96.5% - 97.0% ] 96.72% | 16,594 | 17.8% |
[ 97.0% - 97.5% ] 97.25% | 2,729 | 14.7% |
[ 97.5% - 98.0% ] 97.87% | 9,799 | 22.2% |
[ 98.0% - 98.5% ] 98.34% | 3,915 | 21.8% |
[ 98.5% - 99.0% ] 98.90% | 5,369 | 16.2% |
[ 99.0% - 99.5% ] 99.29% | 11,442 | 18.8% |
[ 99.5% - 100.0% ] 100.00% | 6,884 | 24.8% |