Lebanese Married-Couple Family Poverty

COMPARE

Lebanese
Race
Ancestry
AfghanAfricanAlaska NativeAlaskan AthabascanAlbanianAleutAlsatianAmericanApacheArabArapahoArgentineanArmenianAssyrian/Chaldean/SyriacAustralianAustrianBahamianBangladeshiBarbadianBasqueBelgianBelizeanBermudanBhutaneseBlackfeetBolivianBrazilianBritishBritish West IndianBulgarianBurmeseCajunCambodianCanadianCape VerdeanCarpatho RusynCelticCentral AmericanCentral American IndianCherokeeCheyenneChickasawChileanChineseChippewaChoctawColombianColvilleComancheCosta RicanCreeCreekCroatianCrowCubanCypriotCzechCzechoslovakianDanishDelawareDominicanDutchDutch West IndianEastern EuropeanEcuadorianEgyptianEnglishEstonianEthiopianEuropeanFijianFilipinoFinnishFrenchFrench American IndianFrench CanadianGermanGerman RussianGhanaianGreekGuamanian/ChamorroGuatemalanGuyaneseHaitianHmongHonduranHopiHoumaHungarianIcelanderIndian (Asian)IndonesianInupiatIranianIraqiIrishIroquoisIsraeliItalianJamaicanJapaneseJordanianKenyanKiowaKoreanLaotianLatvianLebaneseLiberianLithuanianLumbeeLuxembourgerMacedonianMalaysianMalteseMarshalleseMenomineeMexicanMexican American IndianMongolianMoroccanNative HawaiianNavajoNepaleseNew ZealanderNicaraguanNigerianNorthern EuropeanNorwegianOkinawanOsageOttawaPaiutePakistaniPalestinianPanamanianParaguayanPennsylvania GermanPeruvianPimaPolishPortuguesePotawatomiPuebloPuerto RicanPuget Sound SalishRomanianRussianSalvadoranSamoanScandinavianScotch-IrishScottishSeminoleSenegaleseSerbianShoshoneSierra LeoneanSiouxSlavicSlovakSloveneSomaliSouth AfricanSouth AmericanSouth American IndianSoviet UnionSpaniardSpanishSpanish AmericanSpanish American IndianSri LankanSubsaharan AfricanSudaneseSwedishSwissSyrianTaiwaneseThaiTlingit-HaidaTohono O'OdhamTonganTrinidadian and TobagonianTsimshianTurkishU.S. Virgin IslanderUgandanUkrainianUruguayanUteVenezuelanVietnameseWelshWest IndianYakamaYaquiYugoslavianYumanYup'ikZimbabwean
Immigration
NonimmigrantsImmigrantsAfghanistanAfricaAlbaniaArgentinaArmeniaAsiaAustraliaAustriaBahamasBangladeshBarbadosBelarusBelgiumBelizeBoliviaBosnia and HerzegovinaBrazilBulgariaBurma/MyanmarCabo VerdeCambodiaCameroonCanadaCaribbeanCentral AmericaChileChinaColombiaCongoCosta RicaCroatiaCubaCzechoslovakiaDenmarkDominicaDominican RepublicEastern AfricaEastern AsiaEastern EuropeEcuadorEgyptEl SalvadorEnglandEritreaEthiopiaEuropeFijiFranceGermanyGhanaGreeceGrenadaGuatemalaGuyanaHaitiHondurasHong KongHungaryIndiaIndonesiaIranIraqIrelandIsraelItalyJamaicaJapanJordanKazakhstanKenyaKoreaKuwaitLaosLatin AmericaLatviaLebanonLiberiaLithuaniaMalaysiaMexicoMicronesiaMiddle AfricaMoldovaMoroccoNepalNetherlandsNicaraguaNigeriaNorth AmericaNorth MacedoniaNorthern AfricaNorthern EuropeNorwayOceaniaPakistanPanamaPeruPhilippinesPolandPortugalRomaniaRussiaSaudi ArabiaScotlandSenegalSerbiaSierra LeoneSingaporeSomaliaSouth AfricaSouth AmericaSouth Central AsiaSouth Eastern AsiaSouthern EuropeSpainSri LankaSt. Vincent and the GrenadinesSudanSwedenSwitzerlandSyriaTaiwanThailandTrinidad and TobagoTurkeyUgandaUkraineUruguayUzbekistanVenezuelaVietnamWest IndiesWestern AfricaWestern AsiaWestern EuropeYemenZaireZimbabweAzores
Select to Compare
Race
Ancestry
AfghanAfricanAlaska NativeAlaskan AthabascanAlbanianAleutAlsatianAmericanApacheArabArapahoArgentineanArmenianAssyrian/Chaldean/SyriacAustralianAustrianBahamianBangladeshiBarbadianBasqueBelgianBelizeanBermudanBhutaneseBlackfeetBolivianBrazilianBritishBritish West IndianBulgarianBurmeseCajunCambodianCanadianCape VerdeanCarpatho RusynCelticCentral AmericanCentral American IndianCherokeeCheyenneChickasawChileanChineseChippewaChoctawColombianColvilleComancheCosta RicanCreeCreekCroatianCrowCubanCypriotCzechCzechoslovakianDanishDelawareDominicanDutchDutch West IndianEastern EuropeanEcuadorianEgyptianEnglishEstonianEthiopianEuropeanFijianFilipinoFinnishFrenchFrench American IndianFrench CanadianGermanGerman RussianGhanaianGreekGuamanian/ChamorroGuatemalanGuyaneseHaitianHmongHonduranHopiHoumaHungarianIcelanderIndian (Asian)IndonesianInupiatIranianIraqiIrishIroquoisIsraeliItalianJamaicanJapaneseJordanianKenyanKiowaKoreanLaotianLatvianLiberianLithuanianLumbeeLuxembourgerMacedonianMalaysianMalteseMarshalleseMenomineeMexicanMexican American IndianMongolianMoroccanNative HawaiianNavajoNepaleseNew ZealanderNicaraguanNigerianNorthern EuropeanNorwegianOkinawanOsageOttawaPaiutePakistaniPalestinianPanamanianParaguayanPennsylvania GermanPeruvianPimaPolishPortuguesePotawatomiPuebloPuerto RicanPuget Sound SalishRomanianRussianSalvadoranSamoanScandinavianScotch-IrishScottishSeminoleSenegaleseSerbianShoshoneSierra LeoneanSiouxSlavicSlovakSloveneSomaliSouth AfricanSouth AmericanSouth American IndianSoviet UnionSpaniardSpanishSpanish AmericanSpanish American IndianSri LankanSubsaharan AfricanSudaneseSwedishSwissSyrianTaiwaneseThaiTlingit-HaidaTohono O'OdhamTonganTrinidadian and TobagonianTsimshianTurkishU.S. Virgin IslanderUgandanUkrainianUruguayanUteVenezuelanVietnameseWelshWest IndianYakamaYaquiYugoslavianYumanYup'ikZimbabwean
Immigration
NonimmigrantsImmigrantsAfghanistanAfricaAlbaniaArgentinaArmeniaAsiaAustraliaAustriaBahamasBangladeshBarbadosBelarusBelgiumBelizeBoliviaBosnia and HerzegovinaBrazilBulgariaBurma/MyanmarCabo VerdeCambodiaCameroonCanadaCaribbeanCentral AmericaChileChinaColombiaCongoCosta RicaCroatiaCubaCzechoslovakiaDenmarkDominicaDominican RepublicEastern AfricaEastern AsiaEastern EuropeEcuadorEgyptEl SalvadorEnglandEritreaEthiopiaEuropeFijiFranceGermanyGhanaGreeceGrenadaGuatemalaGuyanaHaitiHondurasHong KongHungaryIndiaIndonesiaIranIraqIrelandIsraelItalyJamaicaJapanJordanKazakhstanKenyaKoreaKuwaitLaosLatin AmericaLatviaLebanonLiberiaLithuaniaMalaysiaMexicoMicronesiaMiddle AfricaMoldovaMoroccoNepalNetherlandsNicaraguaNigeriaNorth AmericaNorth MacedoniaNorthern AfricaNorthern EuropeNorwayOceaniaPakistanPanamaPeruPhilippinesPolandPortugalRomaniaRussiaSaudi ArabiaScotlandSenegalSerbiaSierra LeoneSingaporeSomaliaSouth AfricaSouth AmericaSouth Central AsiaSouth Eastern AsiaSouthern EuropeSpainSri LankaSt. Vincent and the GrenadinesSudanSwedenSwitzerlandSyriaTaiwanThailandTrinidad and TobagoTurkeyUgandaUkraineUruguayUzbekistanVenezuelaVietnamWest IndiesWestern AfricaWestern AsiaWestern EuropeYemenZaireZimbabweAzores
Married-Couple Family Poverty
Income
Poverty
Unemployment
Labor Participation
Family Structure
Vehicle Availability
Education Level
Disability

Lebanese Married-Couple Family Poverty
Fair

5.4%
POVERTY | MARRIED-COUPLE FAMILIES
24.1/ 100
METRIC RATING
201st/ 347
METRIC RANK

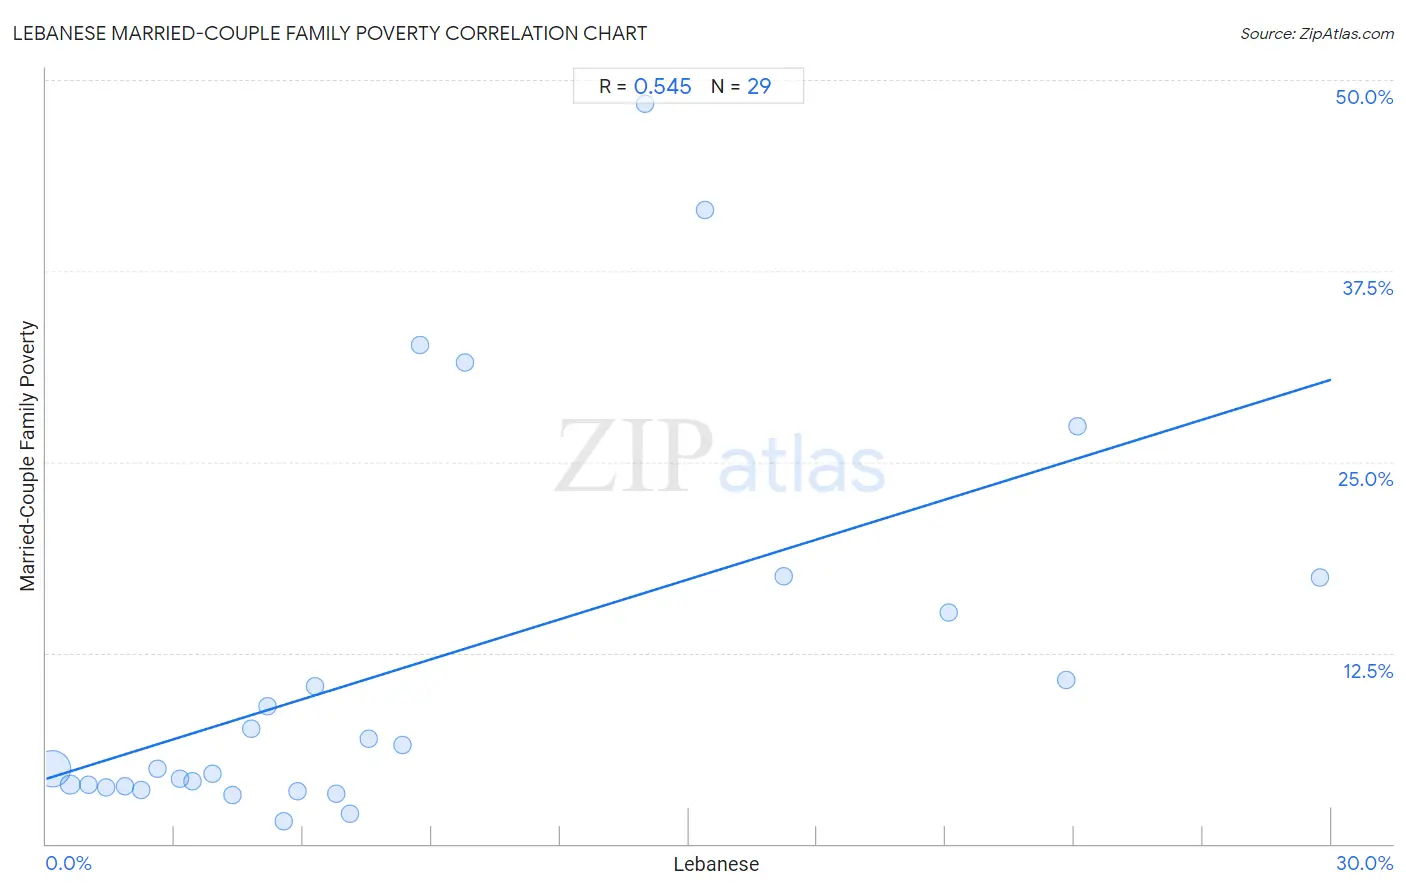
Lebanese Married-Couple Family Poverty Correlation Chart

The statistical analysis conducted on geographies consisting of 397,468,310 people shows a substantial positive correlation between the proportion of Lebanese and poverty level among married-couple families in the United States with a correlation coefficient (R) of 0.545 and weighted average of 5.4%. On average, for every 1% (one percent) increase in Lebanese within a typical geography, there is an increase of 0.87% in poverty level among married-couple families.
Lebanese Married-Couple Family Poverty
It is essential to understand that the correlation between the percentage of Lebanese and poverty level among married-couple families does not imply a direct cause-and-effect relationship. It remains uncertain whether the presence of Lebanese influences an upward or downward trend in the level of poverty level among married-couple families within an area, or if Lebanese simply ended up residing in those areas with higher or lower levels of poverty level among married-couple families due to other factors.

Demographics Similar to Lebanese by Married-Couple Family Poverty

In terms of married-couple family poverty, the demographic groups most similar to Lebanese are Immigrants from Morocco (5.4%, a difference of 0.020%), Immigrants from Middle Africa (5.4%, a difference of 0.060%), Uruguayan (5.4%, a difference of 0.13%), Immigrants from Belarus (5.4%, a difference of 0.30%), and Liberian (5.4%, a difference of 0.33%).
DemographicsRating | RankMarried-Couple Family Poverty
Immigrants from Israel
27.8
/100
|
#194
Fair
5.4%
Immigrants from the Azores
27.5
/100
|
#195
Fair
5.4%
Spaniards
27.4
/100
|
#196
Fair
5.4%
Liberians
26.3
/100
|
#197
Fair
5.4%
Immigrants from Belarus
26.2
/100
|
#198
Fair
5.4%
Uruguayans
25.0
/100
|
#199
Fair
5.4%
Immigrants from Morocco
24.3
/100
|
#200
Fair
5.4%
Lebanese
24.1
/100
|
#201
Fair
5.4%
Immigrants from Middle Africa
23.8
/100
|
#202
Fair
5.4%
Immigrants from Peru
21.8
/100
|
#203
Fair
5.4%
Immigrants from Costa Rica
19.4
/100
|
#204
Poor
5.4%
Chippewa
18.9
/100
|
#205
Poor
5.4%
Osage
18.4
/100
|
#206
Poor
5.4%
Immigrants from Africa
17.6
/100
|
#207
Poor
5.5%
French American Indians
16.1
/100
|
#208
Poor
5.5%

Lebanese Married-Couple Family Poverty Correlation Summary

MeasurementLebanese DataMarried-Couple Family Poverty Data
Minimum0.14%1.5%
Maximum29.7%48.5%
Range29.6%47.0%
Mean8.5%11.6%
Median5.9%4.9%
Interquartile 25% (IQ1)2.9%3.7%
Interquartile 75% (IQ3)11.9%16.3%
Interquartile Range (IQR)9.0%12.6%
Standard Deviation (Sample)7.9%12.6%
Standard Deviation (Population)7.8%12.4%

Correlation Details

Lebanese PercentileSample SizeMarried-Couple Family Poverty
[
0.0%
-
0.5%
]
0.14%
346,393,0704.9%
[
0.5%
-
1.0%
]
0.55%
36,773,4583.9%
[
0.5%
-
1.0%
]
0.99%
8,384,8843.9%
[
1.0%
-
1.5%
]
1.39%
3,168,1373.7%
[
1.5%
-
2.0%
]
1.84%
1,107,0993.7%
[
2.0%
-
2.5%
]
2.21%
548,2613.5%
[
2.5%
-
3.0%
]
2.60%
407,8844.9%
[
3.0%
-
3.5%
]
3.13%
131,2164.3%
[
3.0%
-
3.5%
]
3.43%
54,7604.1%
[
3.5%
-
4.0%
]
3.89%
116,9674.6%
[
4.0%
-
4.5%
]
4.36%
12,6153.2%
[
4.5%
-
5.0%
]
4.79%
8,7857.5%
[
5.0%
-
5.5%
]
5.16%
27,8149.0%
[
5.5%
-
6.0%
]
5.53%
7,7901.5%
[
5.5%
-
6.0%
]
5.86%
2223.4%
[
6.0%
-
6.5%
]
6.29%
82710.3%
[
6.5%
-
7.0%
]
6.76%
5,5153.3%
[
7.0%
-
7.5%
]
7.08%
4,7302.0%
[
7.5%
-
8.0%
]
7.52%
1,2776.8%
[
8.0%
-
8.5%
]
8.31%
34,3716.5%
[
8.5%
-
9.0%
]
8.72%
47032.6%
[
9.5%
-
10.0%
]
9.77%
87031.5%
[
13.5%
-
14.0%
]
13.97%
22948.5%
[
15.0%
-
15.5%
]
15.38%
15641.5%
[
17.0%
-
17.5%
]
17.21%
108,58817.6%
[
21.0%
-
21.5%
]
21.06%
62,47415.1%
[
23.5%
-
24.0%
]
23.82%
12,40510.8%
[
24.0%
-
24.5%
]
24.07%
53,04427.3%
[
29.5%
-
30.0%
]
29.74%
40,39217.4%