Korean College, 1 year or more
COMPARE
Korean
Select to Compare
College, 1 year or more
Korean College, 1 year or more
59.7%
COLLEGE, 1 YEAR OR MORE
58.5/ 100
METRIC RATING
162nd/ 347
METRIC RANK
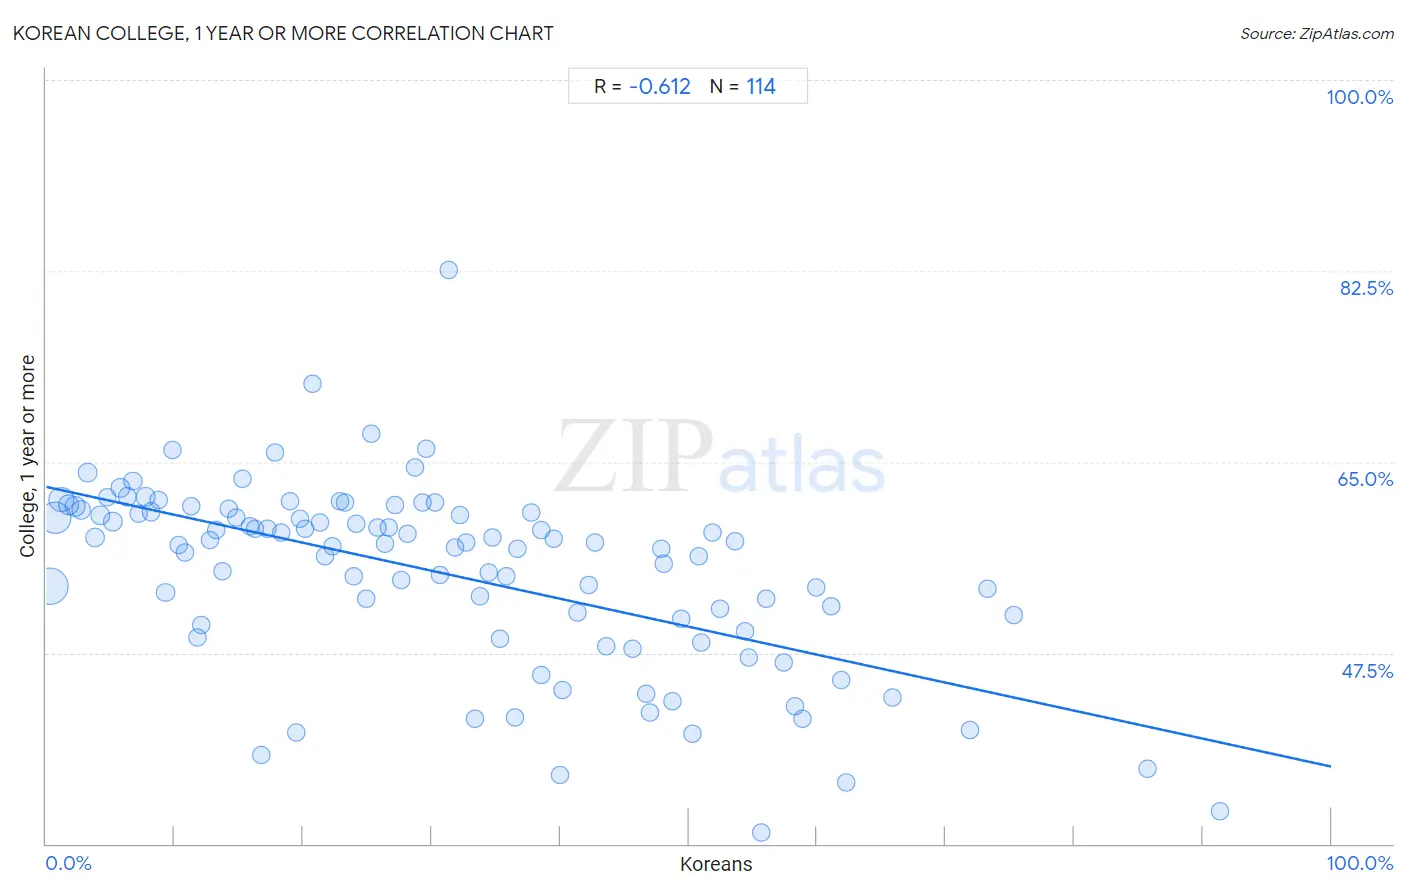
Korean College, 1 year or more Correlation Chart
The statistical analysis conducted on geographies consisting of 510,942,861 people shows a significant negative correlation between the proportion of Koreans and percentage of population with at least college, 1 year or more education in the United States with a correlation coefficient (R) of -0.612 and weighted average of 59.7%. On average, for every 1% (one percent) increase in Koreans within a typical geography, there is a decrease of 0.26% in percentage of population with at least college, 1 year or more education.
It is essential to understand that the correlation between the percentage of Koreans and percentage of population with at least college, 1 year or more education does not imply a direct cause-and-effect relationship. It remains uncertain whether the presence of Koreans influences an upward or downward trend in the level of percentage of population with at least college, 1 year or more education within an area, or if Koreans simply ended up residing in those areas with higher or lower levels of percentage of population with at least college, 1 year or more education due to other factors.
Demographics Similar to Koreans by College, 1 year or more
In terms of college, 1 year or more, the demographic groups most similar to Koreans are Immigrants from Somalia (59.7%, a difference of 0.010%), Belgian (59.7%, a difference of 0.020%), Irish (59.6%, a difference of 0.13%), Immigrants from Africa (59.6%, a difference of 0.13%), and Immigrants from North Macedonia (59.5%, a difference of 0.29%).
| Demographics | Rating | Rank | College, 1 year or more |
| Moroccans | 72.9 /100 | #155 | Good 60.2% |
| Finns | 72.9 /100 | #156 | Good 60.2% |
| Immigrants from Armenia | 68.8 /100 | #157 | Good 60.0% |
| English | 67.2 /100 | #158 | Good 60.0% |
| Immigrants from Iraq | 67.0 /100 | #159 | Good 60.0% |
| South American Indians | 66.9 /100 | #160 | Good 60.0% |
| Somalis | 64.5 /100 | #161 | Good 59.9% |
| Koreans | 58.5 /100 | #162 | Average 59.7% |
| Immigrants from Somalia | 58.3 /100 | #163 | Average 59.7% |
| Belgians | 58.1 /100 | #164 | Average 59.7% |
| Irish | 56.1 /100 | #165 | Average 59.6% |
| Immigrants from Africa | 56.1 /100 | #166 | Average 59.6% |
| Immigrants from North Macedonia | 53.1 /100 | #167 | Average 59.5% |
| Hungarians | 52.9 /100 | #168 | Average 59.5% |
| Immigrants from Southern Europe | 52.7 /100 | #169 | Average 59.5% |
Korean College, 1 year or more Correlation Summary
| Measurement | Korean Data | College, 1 year or more Data |
| Minimum | 0.26% | 31.0% |
| Maximum | 91.3% | 82.6% |
| Range | 91.1% | 51.6% |
| Mean | 30.9% | 54.8% |
| Median | 28.4% | 57.4% |
| Interquartile 25% (IQ1) | 14.2% | 50.1% |
| Interquartile 75% (IQ3) | 46.7% | 60.4% |
| Interquartile Range (IQR) | 32.5% | 10.3% |
| Standard Deviation (Sample) | 20.4% | 8.5% |
| Standard Deviation (Population) | 20.3% | 8.5% |
Correlation Details
| Korean Percentile | Sample Size | College, 1 year or more |
[ 0.0% - 0.5% ] 0.26% | 182,188,139 | 53.5% |
[ 0.5% - 1.0% ] 0.71% | 128,808,383 | 59.9% |
[ 1.0% - 1.5% ] 1.21% | 69,503,367 | 61.5% |
[ 1.5% - 2.0% ] 1.72% | 27,322,416 | 61.0% |
[ 2.0% - 2.5% ] 2.25% | 21,305,960 | 60.9% |
[ 2.5% - 3.0% ] 2.73% | 14,066,847 | 60.6% |
[ 3.0% - 3.5% ] 3.23% | 9,967,878 | 64.0% |
[ 3.5% - 4.0% ] 3.78% | 11,660,911 | 58.0% |
[ 4.0% - 4.5% ] 4.21% | 6,696,405 | 60.1% |
[ 4.5% - 5.0% ] 4.74% | 4,881,656 | 61.8% |
[ 5.0% - 5.5% ] 5.19% | 5,277,502 | 59.5% |
[ 5.5% - 6.0% ] 5.76% | 4,756,644 | 62.6% |
[ 6.0% - 6.5% ] 6.28% | 3,703,156 | 61.8% |
[ 6.5% - 7.0% ] 6.74% | 3,938,556 | 63.3% |
[ 7.0% - 7.5% ] 7.23% | 1,673,659 | 60.2% |
[ 7.5% - 8.0% ] 7.73% | 1,037,986 | 61.8% |
[ 8.0% - 8.5% ] 8.18% | 2,079,532 | 60.4% |
[ 8.5% - 9.0% ] 8.72% | 1,395,961 | 61.5% |
[ 9.0% - 9.5% ] 9.29% | 1,265,087 | 53.1% |
[ 9.5% - 10.0% ] 9.79% | 724,954 | 66.1% |
[ 10.0% - 10.5% ] 10.34% | 507,136 | 57.4% |
[ 10.5% - 11.0% ] 10.77% | 452,187 | 56.7% |
[ 11.0% - 11.5% ] 11.25% | 622,331 | 60.9% |
[ 11.5% - 12.0% ] 11.80% | 554,342 | 48.9% |
[ 12.0% - 12.5% ] 12.08% | 193,138 | 50.1% |
[ 12.5% - 13.0% ] 12.77% | 336,256 | 57.9% |
[ 13.0% - 13.5% ] 13.22% | 183,433 | 58.7% |
[ 13.5% - 14.0% ] 13.68% | 440,914 | 55.0% |
[ 14.0% - 14.5% ] 14.18% | 572,002 | 60.7% |
[ 14.5% - 15.0% ] 14.77% | 121,416 | 59.9% |
[ 15.0% - 15.5% ] 15.29% | 372,647 | 63.5% |
[ 15.5% - 16.0% ] 15.81% | 195,578 | 59.1% |
[ 16.0% - 16.5% ] 16.23% | 124,277 | 58.9% |
[ 16.5% - 17.0% ] 16.68% | 77,821 | 38.1% |
[ 17.0% - 17.5% ] 17.24% | 253,602 | 58.8% |
[ 17.5% - 18.0% ] 17.76% | 148,086 | 65.9% |
[ 18.0% - 18.5% ] 18.25% | 39,755 | 58.6% |
[ 18.5% - 19.0% ] 18.95% | 60,506 | 61.4% |
[ 19.0% - 19.5% ] 19.41% | 11,630 | 40.2% |
[ 19.5% - 20.0% ] 19.72% | 546,181 | 59.8% |
[ 20.0% - 20.5% ] 20.10% | 142,971 | 58.9% |
[ 20.5% - 21.0% ] 20.70% | 54,997 | 72.2% |
[ 21.0% - 21.5% ] 21.34% | 179,148 | 59.4% |
[ 21.5% - 22.0% ] 21.73% | 181,847 | 56.3% |
[ 22.0% - 22.5% ] 22.29% | 171,335 | 57.3% |
[ 22.5% - 23.0% ] 22.84% | 245,194 | 61.4% |
[ 23.0% - 23.5% ] 23.22% | 147,682 | 61.3% |
[ 23.5% - 24.0% ] 23.97% | 5,023 | 54.5% |
[ 24.0% - 24.5% ] 24.12% | 8,433 | 59.3% |
[ 24.5% - 25.0% ] 24.87% | 105,082 | 52.4% |
[ 25.0% - 25.5% ] 25.32% | 71,469 | 67.6% |
[ 25.5% - 26.0% ] 25.79% | 57,901 | 59.0% |
[ 26.0% - 26.5% ] 26.35% | 28,564 | 57.5% |
[ 26.5% - 27.0% ] 26.68% | 21,120 | 58.9% |
[ 27.0% - 27.5% ] 27.14% | 56,287 | 61.0% |
[ 27.5% - 28.0% ] 27.62% | 45,724 | 54.2% |
[ 28.0% - 28.5% ] 28.12% | 79,785 | 58.4% |
[ 28.5% - 29.0% ] 28.71% | 55,183 | 64.4% |
[ 29.0% - 29.5% ] 29.30% | 18,216 | 61.2% |
[ 29.5% - 30.0% ] 29.54% | 61,044 | 66.2% |
[ 30.0% - 30.5% ] 30.25% | 64,624 | 61.3% |
[ 30.5% - 31.0% ] 30.67% | 46,802 | 54.7% |
[ 31.0% - 31.5% ] 31.35% | 1,461 | 82.6% |
[ 31.5% - 32.0% ] 31.79% | 115,123 | 57.2% |
[ 32.0% - 32.5% ] 32.22% | 149,325 | 60.1% |
[ 32.5% - 33.0% ] 32.72% | 162,383 | 57.6% |
[ 33.0% - 33.5% ] 33.36% | 7,363 | 41.5% |
[ 33.5% - 34.0% ] 33.74% | 4,721 | 52.7% |
[ 34.0% - 34.5% ] 34.42% | 459 | 54.8% |
[ 34.5% - 35.0% ] 34.74% | 2,896 | 58.0% |
[ 35.0% - 35.5% ] 35.29% | 255 | 48.8% |
[ 35.5% - 36.0% ] 35.84% | 24,950 | 54.5% |
[ 36.0% - 36.5% ] 36.46% | 1,629 | 41.6% |
[ 36.5% - 37.0% ] 36.63% | 25,099 | 57.1% |
[ 37.5% - 38.0% ] 37.77% | 26,169 | 60.4% |
[ 38.0% - 38.5% ] 38.49% | 12,906 | 45.5% |
[ 38.5% - 39.0% ] 38.53% | 6,419 | 58.8% |
[ 39.0% - 39.5% ] 39.49% | 1,023 | 58.0% |
[ 39.5% - 40.0% ] 39.96% | 548 | 36.3% |
[ 40.0% - 40.5% ] 40.17% | 1,917 | 44.1% |
[ 41.0% - 41.5% ] 41.37% | 17,400 | 51.2% |
[ 42.0% - 42.5% ] 42.22% | 5,393 | 53.7% |
[ 42.5% - 43.0% ] 42.74% | 3,053 | 57.6% |
[ 43.5% - 44.0% ] 43.57% | 3,576 | 48.1% |
[ 45.5% - 46.0% ] 45.67% | 7,728 | 47.9% |
[ 46.5% - 47.0% ] 46.69% | 59,008 | 43.8% |
[ 47.0% - 47.5% ] 47.01% | 1,372 | 42.1% |
[ 47.5% - 48.0% ] 47.85% | 82,955 | 57.0% |
[ 48.0% - 48.5% ] 48.05% | 17,604 | 55.7% |
[ 48.5% - 49.0% ] 48.76% | 484 | 43.0% |
[ 49.0% - 49.5% ] 49.39% | 2,290 | 50.6% |
[ 50.0% - 50.5% ] 50.27% | 2,242 | 40.1% |
[ 50.5% - 51.0% ] 50.78% | 27,198 | 56.4% |
[ 51.0% - 51.5% ] 51.01% | 30,256 | 48.4% |
[ 51.5% - 52.0% ] 51.87% | 6,593 | 58.5% |
[ 52.0% - 52.5% ] 52.44% | 25,902 | 51.5% |
[ 53.5% - 54.0% ] 53.63% | 17,137 | 57.7% |
[ 54.0% - 54.5% ] 54.42% | 5,026 | 49.5% |
[ 54.5% - 55.0% ] 54.63% | 3,174 | 47.1% |
[ 55.5% - 56.0% ] 55.61% | 838 | 31.0% |
[ 56.0% - 56.5% ] 56.07% | 72,605 | 52.5% |
[ 57.0% - 57.5% ] 57.43% | 3,961 | 46.6% |
[ 58.0% - 58.5% ] 58.31% | 890 | 42.6% |
[ 58.5% - 59.0% ] 58.86% | 3,262 | 41.4% |
[ 59.5% - 60.0% ] 59.90% | 2,334 | 53.4% |
[ 61.0% - 61.5% ] 61.06% | 2,255 | 51.7% |
[ 61.5% - 62.0% ] 61.89% | 19,795 | 45.0% |
[ 62.0% - 62.5% ] 62.24% | 3,909 | 35.7% |
[ 65.5% - 66.0% ] 65.90% | 39,873 | 43.4% |
[ 71.5% - 72.0% ] 71.88% | 6,550 | 40.5% |
[ 73.0% - 73.5% ] 73.27% | 1,949 | 53.4% |
[ 75.0% - 75.5% ] 75.28% | 1,897 | 51.0% |
[ 85.5% - 86.0% ] 85.71% | 42 | 36.8% |
[ 91.0% - 91.5% ] 91.32% | 2,996 | 33.0% |