Kenyan Wage/Income Gap
COMPARE
Kenyan
Select to Compare
Wage/Income Gap
Kenyan Wage/Income Gap
24.5%
WAGE/INCOME GAP
95.8/ 100
METRIC RATING
119th/ 347
METRIC RANK
Kenyan Wage/Income Gap Correlation Chart
The statistical analysis conducted on geographies consisting of 168,231,512 people shows a poor positive correlation between the proportion of Kenyans and wage/income gap percentage in the United States with a correlation coefficient (R) of 0.195 and weighted average of 24.5%. On average, for every 1% (one percent) increase in Kenyans within a typical geography, there is an increase of 0.40% in wage/income gap percentage.
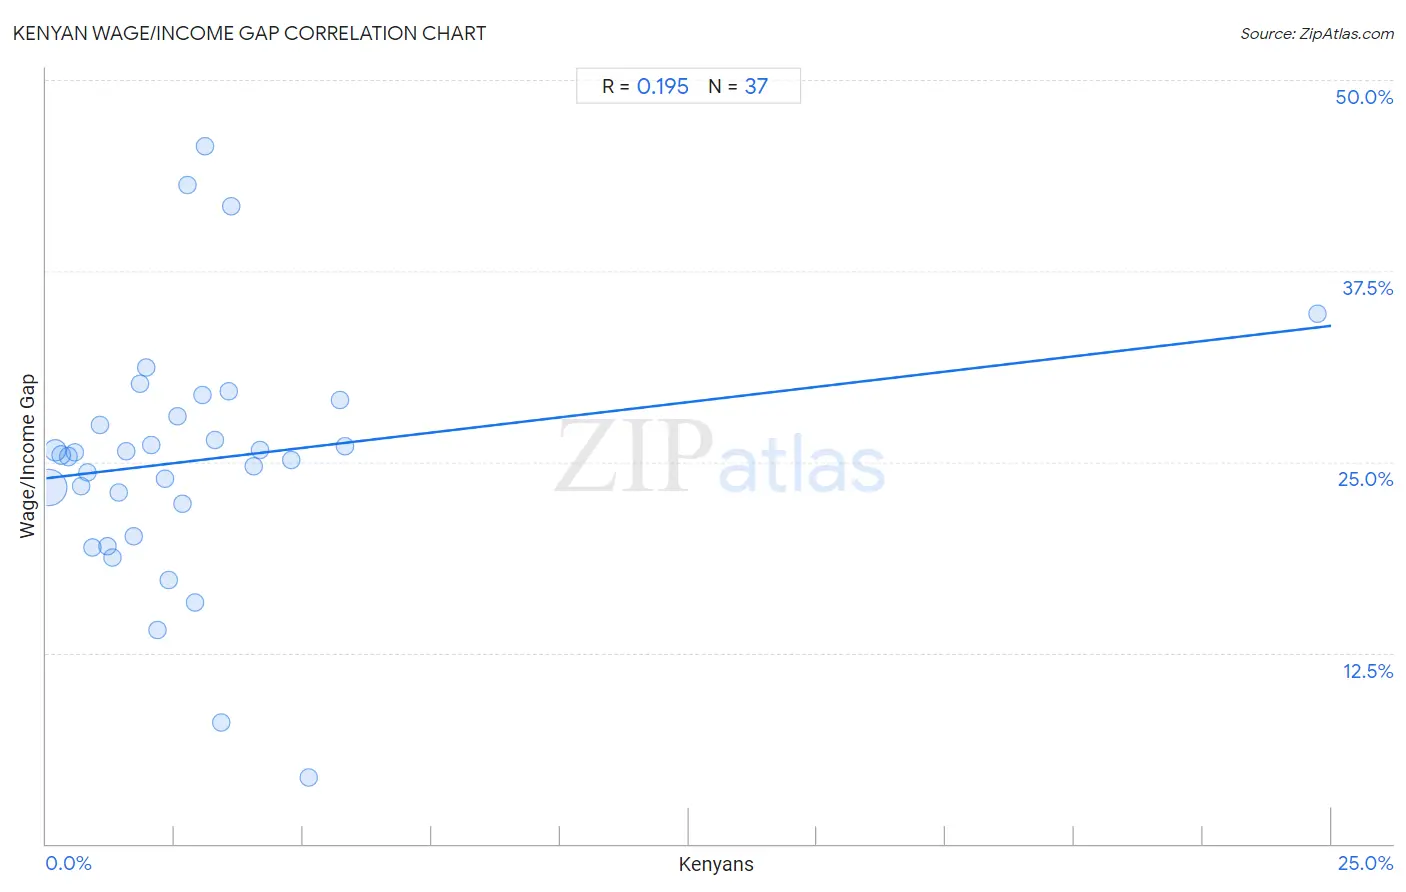
It is essential to understand that the correlation between the percentage of Kenyans and wage/income gap percentage does not imply a direct cause-and-effect relationship. It remains uncertain whether the presence of Kenyans influences an upward or downward trend in the level of wage/income gap percentage within an area, or if Kenyans simply ended up residing in those areas with higher or lower levels of wage/income gap percentage due to other factors.
Demographics Similar to Kenyans by Wage/Income Gap
In terms of wage/income gap, the demographic groups most similar to Kenyans are Immigrants from Micronesia (24.4%, a difference of 0.020%), Immigrants from Afghanistan (24.4%, a difference of 0.050%), Cree (24.5%, a difference of 0.070%), Alaska Native (24.4%, a difference of 0.11%), and Immigrants from Kenya (24.4%, a difference of 0.28%).
| Demographics | Rating | Rank | Wage/Income Gap |
| Immigrants from Colombia | 97.0 /100 | #112 | Exceptional 24.3% |
| Sioux | 96.9 /100 | #113 | Exceptional 24.3% |
| Panamanians | 96.5 /100 | #114 | Exceptional 24.4% |
| Immigrants from Kenya | 96.4 /100 | #115 | Exceptional 24.4% |
| Alaska Natives | 96.0 /100 | #116 | Exceptional 24.4% |
| Immigrants from Afghanistan | 95.9 /100 | #117 | Exceptional 24.4% |
| Immigrants from Micronesia | 95.8 /100 | #118 | Exceptional 24.4% |
| Kenyans | 95.8 /100 | #119 | Exceptional 24.5% |
| Cree | 95.6 /100 | #120 | Exceptional 24.5% |
| Immigrants from Thailand | 94.9 /100 | #121 | Exceptional 24.5% |
| Apache | 94.8 /100 | #122 | Exceptional 24.5% |
| Natives/Alaskans | 94.6 /100 | #123 | Exceptional 24.6% |
| Immigrants from South America | 93.9 /100 | #124 | Exceptional 24.6% |
| Spanish Americans | 93.8 /100 | #125 | Exceptional 24.6% |
| Immigrants from Uruguay | 93.8 /100 | #126 | Exceptional 24.6% |
Kenyan Wage/Income Gap Correlation Summary
| Measurement | Kenyan Data | Wage/Income Gap Data |
| Minimum | 0.039% | 4.3% |
| Maximum | 24.7% | 45.6% |
| Range | 24.7% | 41.3% |
| Mean | 3.0% | 25.1% |
| Median | 2.3% | 25.4% |
| Interquartile 25% (IQ1) | 1.1% | 21.2% |
| Interquartile 75% (IQ3) | 3.5% | 28.5% |
| Interquartile Range (IQR) | 2.4% | 7.3% |
| Standard Deviation (Sample) | 4.0% | 8.2% |
| Standard Deviation (Population) | 3.9% | 8.1% |
Correlation Details
| Kenyan Percentile | Sample Size | Wage/Income Gap |
[ 0.0% - 0.5% ] 0.039% | 126,537,217 | 23.4% |
[ 0.0% - 0.5% ] 0.17% | 21,806,339 | 25.8% |
[ 0.0% - 0.5% ] 0.30% | 8,430,590 | 25.4% |
[ 0.0% - 0.5% ] 0.43% | 4,726,962 | 25.4% |
[ 0.5% - 1.0% ] 0.55% | 2,142,018 | 25.6% |
[ 0.5% - 1.0% ] 0.67% | 1,169,136 | 23.4% |
[ 0.5% - 1.0% ] 0.80% | 975,254 | 24.3% |
[ 0.5% - 1.0% ] 0.90% | 446,717 | 19.4% |
[ 1.0% - 1.5% ] 1.05% | 433,161 | 27.4% |
[ 1.0% - 1.5% ] 1.19% | 330,826 | 19.4% |
[ 1.0% - 1.5% ] 1.30% | 231,594 | 18.8% |
[ 1.0% - 1.5% ] 1.41% | 210,333 | 23.0% |
[ 1.5% - 2.0% ] 1.56% | 192,252 | 25.7% |
[ 1.5% - 2.0% ] 1.69% | 100,838 | 20.1% |
[ 1.5% - 2.0% ] 1.82% | 30,100 | 30.1% |
[ 1.5% - 2.0% ] 1.95% | 131,069 | 31.2% |
[ 2.0% - 2.5% ] 2.05% | 69,612 | 26.1% |
[ 2.0% - 2.5% ] 2.17% | 85,059 | 14.0% |
[ 2.0% - 2.5% ] 2.32% | 62,408 | 23.9% |
[ 2.0% - 2.5% ] 2.38% | 6,863 | 17.3% |
[ 2.5% - 3.0% ] 2.56% | 586 | 28.0% |
[ 2.5% - 3.0% ] 2.65% | 32,186 | 22.3% |
[ 2.5% - 3.0% ] 2.75% | 8,230 | 43.2% |
[ 2.5% - 3.0% ] 2.90% | 3,966 | 15.8% |
[ 3.0% - 3.5% ] 3.03% | 13,459 | 29.3% |
[ 3.0% - 3.5% ] 3.10% | 8,389 | 45.6% |
[ 3.0% - 3.5% ] 3.29% | 2,034 | 26.4% |
[ 3.0% - 3.5% ] 3.40% | 2,764 | 7.9% |
[ 3.5% - 4.0% ] 3.56% | 2,473 | 29.6% |
[ 3.5% - 4.0% ] 3.59% | 3,785 | 41.7% |
[ 4.0% - 4.5% ] 4.04% | 4,261 | 24.7% |
[ 4.0% - 4.5% ] 4.15% | 9,822 | 25.8% |
[ 4.5% - 5.0% ] 4.77% | 9,332 | 25.2% |
[ 5.0% - 5.5% ] 5.11% | 3,838 | 4.3% |
[ 5.5% - 6.0% ] 5.71% | 4,728 | 29.0% |
[ 5.5% - 6.0% ] 5.82% | 3,214 | 26.0% |
[ 24.5% - 25.0% ] 24.74% | 97 | 34.7% |