Kenyan Unemployment Among Women with Children Ages 6 to 17 years

COMPARE

Kenyan
Race
Ancestry
AfghanAfricanAlaska NativeAlaskan AthabascanAlbanianAleutAlsatianAmericanApacheArabArapahoArgentineanArmenianAssyrian/Chaldean/SyriacAustralianAustrianBahamianBangladeshiBarbadianBasqueBelgianBelizeanBermudanBhutaneseBlackfeetBolivianBrazilianBritishBritish West IndianBulgarianBurmeseCajunCambodianCanadianCape VerdeanCarpatho RusynCelticCentral AmericanCentral American IndianCherokeeCheyenneChickasawChileanChineseChippewaChoctawColombianColvilleComancheCosta RicanCreeCreekCroatianCrowCubanCypriotCzechCzechoslovakianDanishDelawareDominicanDutchDutch West IndianEastern EuropeanEcuadorianEgyptianEnglishEstonianEthiopianEuropeanFijianFilipinoFinnishFrenchFrench American IndianFrench CanadianGermanGerman RussianGhanaianGreekGuamanian/ChamorroGuatemalanGuyaneseHaitianHmongHonduranHopiHoumaHungarianIcelanderIndian (Asian)IndonesianInupiatIranianIraqiIrishIroquoisIsraeliItalianJamaicanJapaneseJordanianKenyanKiowaKoreanLaotianLatvianLebaneseLiberianLithuanianLumbeeLuxembourgerMacedonianMalaysianMalteseMarshalleseMenomineeMexicanMexican American IndianMongolianMoroccanNative HawaiianNavajoNepaleseNew ZealanderNicaraguanNigerianNorthern EuropeanNorwegianOkinawanOsageOttawaPaiutePakistaniPalestinianPanamanianParaguayanPennsylvania GermanPeruvianPimaPolishPortuguesePotawatomiPuebloPuerto RicanPuget Sound SalishRomanianRussianSalvadoranSamoanScandinavianScotch-IrishScottishSeminoleSenegaleseSerbianShoshoneSierra LeoneanSiouxSlavicSlovakSloveneSomaliSouth AfricanSouth AmericanSouth American IndianSoviet UnionSpaniardSpanishSpanish AmericanSpanish American IndianSri LankanSubsaharan AfricanSudaneseSwedishSwissSyrianTaiwaneseThaiTlingit-HaidaTohono O'OdhamTonganTrinidadian and TobagonianTsimshianTurkishU.S. Virgin IslanderUgandanUkrainianUruguayanUteVenezuelanVietnameseWelshWest IndianYakamaYaquiYugoslavianYumanYup'ikZimbabwean
Immigration
NonimmigrantsImmigrantsAfghanistanAfricaAlbaniaArgentinaArmeniaAsiaAustraliaAustriaBahamasBangladeshBarbadosBelarusBelgiumBelizeBoliviaBosnia and HerzegovinaBrazilBulgariaBurma/MyanmarCabo VerdeCambodiaCameroonCanadaCaribbeanCentral AmericaChileChinaColombiaCongoCosta RicaCroatiaCubaCzechoslovakiaDenmarkDominicaDominican RepublicEastern AfricaEastern AsiaEastern EuropeEcuadorEgyptEl SalvadorEnglandEritreaEthiopiaEuropeFijiFranceGermanyGhanaGreeceGrenadaGuatemalaGuyanaHaitiHondurasHong KongHungaryIndiaIndonesiaIranIraqIrelandIsraelItalyJamaicaJapanJordanKazakhstanKenyaKoreaKuwaitLaosLatin AmericaLatviaLebanonLiberiaLithuaniaMalaysiaMexicoMicronesiaMiddle AfricaMoldovaMoroccoNepalNetherlandsNicaraguaNigeriaNorth AmericaNorth MacedoniaNorthern AfricaNorthern EuropeNorwayOceaniaPakistanPanamaPeruPhilippinesPolandPortugalRomaniaRussiaSaudi ArabiaScotlandSenegalSerbiaSierra LeoneSingaporeSomaliaSouth AfricaSouth AmericaSouth Central AsiaSouth Eastern AsiaSouthern EuropeSpainSri LankaSt. Vincent and the GrenadinesSudanSwedenSwitzerlandSyriaTaiwanThailandTrinidad and TobagoTurkeyUgandaUkraineUruguayUzbekistanVenezuelaVietnamWest IndiesWestern AfricaWestern AsiaWestern EuropeYemenZaireZimbabweAzores
Select to Compare
Race
Ancestry
AfghanAfricanAlaska NativeAlaskan AthabascanAlbanianAleutAlsatianAmericanApacheArabArapahoArgentineanArmenianAssyrian/Chaldean/SyriacAustralianAustrianBahamianBangladeshiBarbadianBasqueBelgianBelizeanBermudanBhutaneseBlackfeetBolivianBrazilianBritishBritish West IndianBulgarianBurmeseCajunCambodianCanadianCape VerdeanCarpatho RusynCelticCentral AmericanCentral American IndianCherokeeCheyenneChickasawChileanChineseChippewaChoctawColombianColvilleComancheCosta RicanCreeCreekCroatianCrowCubanCypriotCzechCzechoslovakianDanishDelawareDominicanDutchDutch West IndianEastern EuropeanEcuadorianEgyptianEnglishEstonianEthiopianEuropeanFijianFilipinoFinnishFrenchFrench American IndianFrench CanadianGermanGerman RussianGhanaianGreekGuamanian/ChamorroGuatemalanGuyaneseHaitianHmongHonduranHopiHoumaHungarianIcelanderIndian (Asian)IndonesianInupiatIranianIraqiIrishIroquoisIsraeliItalianJamaicanJapaneseJordanianKiowaKoreanLaotianLatvianLebaneseLiberianLithuanianLumbeeLuxembourgerMacedonianMalaysianMalteseMarshalleseMenomineeMexicanMexican American IndianMongolianMoroccanNative HawaiianNavajoNepaleseNew ZealanderNicaraguanNigerianNorthern EuropeanNorwegianOkinawanOsageOttawaPaiutePakistaniPalestinianPanamanianParaguayanPennsylvania GermanPeruvianPimaPolishPortuguesePotawatomiPuebloPuerto RicanPuget Sound SalishRomanianRussianSalvadoranSamoanScandinavianScotch-IrishScottishSeminoleSenegaleseSerbianShoshoneSierra LeoneanSiouxSlavicSlovakSloveneSomaliSouth AfricanSouth AmericanSouth American IndianSoviet UnionSpaniardSpanishSpanish AmericanSpanish American IndianSri LankanSubsaharan AfricanSudaneseSwedishSwissSyrianTaiwaneseThaiTlingit-HaidaTohono O'OdhamTonganTrinidadian and TobagonianTsimshianTurkishU.S. Virgin IslanderUgandanUkrainianUruguayanUteVenezuelanVietnameseWelshWest IndianYakamaYaquiYugoslavianYumanYup'ikZimbabwean
Immigration
NonimmigrantsImmigrantsAfghanistanAfricaAlbaniaArgentinaArmeniaAsiaAustraliaAustriaBahamasBangladeshBarbadosBelarusBelgiumBelizeBoliviaBosnia and HerzegovinaBrazilBulgariaBurma/MyanmarCabo VerdeCambodiaCameroonCanadaCaribbeanCentral AmericaChileChinaColombiaCongoCosta RicaCroatiaCubaCzechoslovakiaDenmarkDominicaDominican RepublicEastern AfricaEastern AsiaEastern EuropeEcuadorEgyptEl SalvadorEnglandEritreaEthiopiaEuropeFijiFranceGermanyGhanaGreeceGrenadaGuatemalaGuyanaHaitiHondurasHong KongHungaryIndiaIndonesiaIranIraqIrelandIsraelItalyJamaicaJapanJordanKazakhstanKenyaKoreaKuwaitLaosLatin AmericaLatviaLebanonLiberiaLithuaniaMalaysiaMexicoMicronesiaMiddle AfricaMoldovaMoroccoNepalNetherlandsNicaraguaNigeriaNorth AmericaNorth MacedoniaNorthern AfricaNorthern EuropeNorwayOceaniaPakistanPanamaPeruPhilippinesPolandPortugalRomaniaRussiaSaudi ArabiaScotlandSenegalSerbiaSierra LeoneSingaporeSomaliaSouth AfricaSouth AmericaSouth Central AsiaSouth Eastern AsiaSouthern EuropeSpainSri LankaSt. Vincent and the GrenadinesSudanSwedenSwitzerlandSyriaTaiwanThailandTrinidad and TobagoTurkeyUgandaUkraineUruguayUzbekistanVenezuelaVietnamWest IndiesWestern AfricaWestern AsiaWestern EuropeYemenZaireZimbabweAzores
Unemployment Among Women with Children Ages 6 to 17 years
Income
Poverty
Unemployment
Labor Participation
Family Structure
Vehicle Availability
Education Level
Disability

Kenyan Unemployment Among Women with Children Ages 6 to 17 years
Excellent

8.8%
UNEMPLOYMENT | WOMEN W/ CHILDREN 6 TO 17
85.6/ 100
METRIC RATING
145th/ 347
METRIC RANK

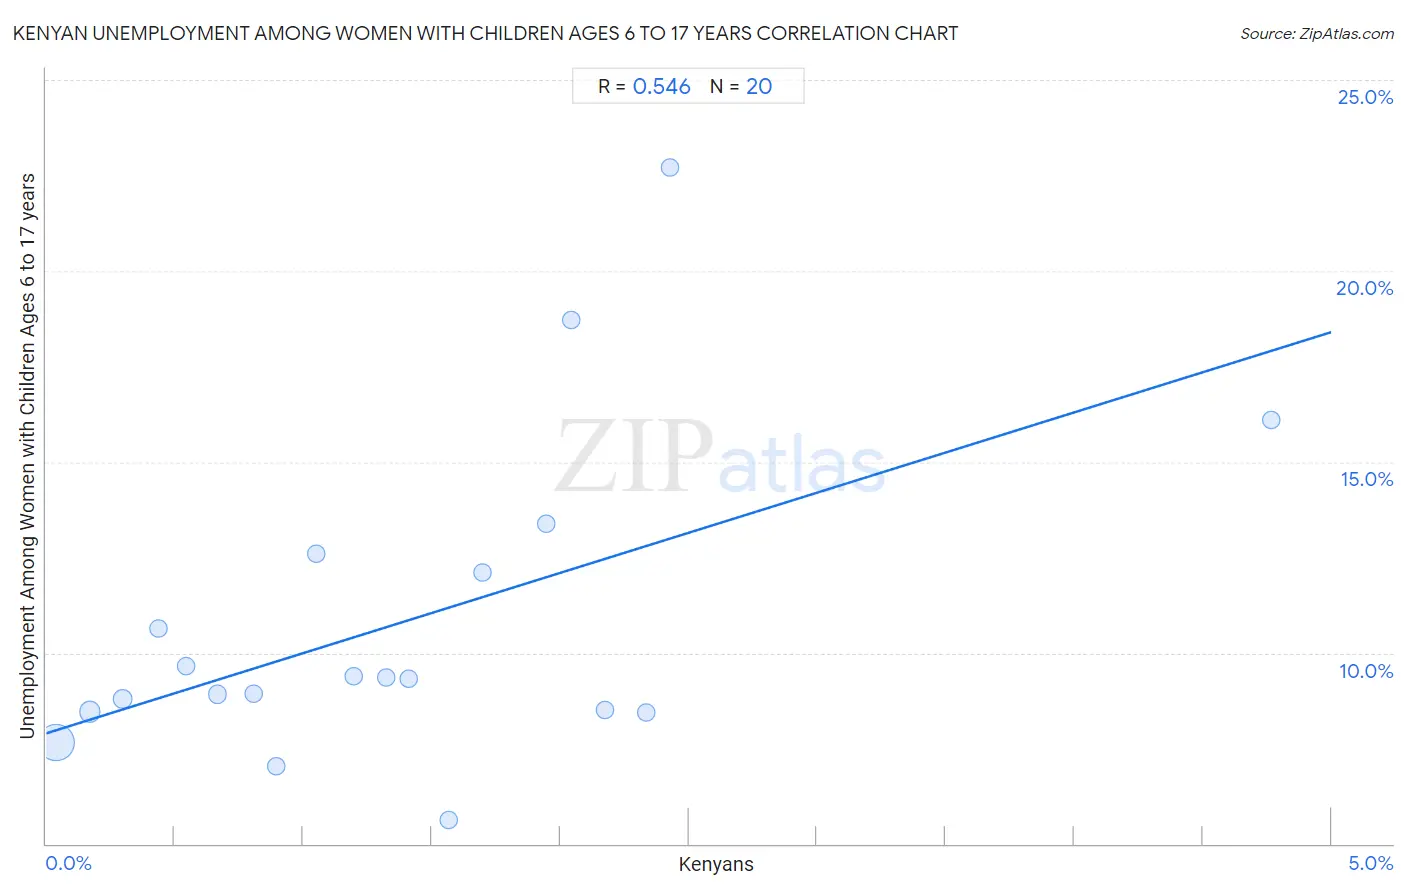
Kenyan Unemployment Among Women with Children Ages 6 to 17 years Correlation Chart

The statistical analysis conducted on geographies consisting of 141,527,073 people shows a substantial positive correlation between the proportion of Kenyans and unemployment rate among women with children between the ages 6 and 17 in the United States with a correlation coefficient (R) of 0.546 and weighted average of 8.8%. On average, for every 1% (one percent) increase in Kenyans within a typical geography, there is an increase of 2.1% in unemployment rate among women with children between the ages 6 and 17.
Kenyan Unemployment Among Women with Children Ages 6 to 17 years
It is essential to understand that the correlation between the percentage of Kenyans and unemployment rate among women with children between the ages 6 and 17 does not imply a direct cause-and-effect relationship. It remains uncertain whether the presence of Kenyans influences an upward or downward trend in the level of unemployment rate among women with children between the ages 6 and 17 within an area, or if Kenyans simply ended up residing in those areas with higher or lower levels of unemployment rate among women with children between the ages 6 and 17 due to other factors.

Demographics Similar to Kenyans by Unemployment Among Women with Children Ages 6 to 17 years

In terms of unemployment among women with children ages 6 to 17 years, the demographic groups most similar to Kenyans are Russian (8.8%, a difference of 0.020%), Immigrants from Kenya (8.8%, a difference of 0.050%), Immigrants from Austria (8.8%, a difference of 0.18%), Serbian (8.8%, a difference of 0.20%), and Immigrants from Poland (8.8%, a difference of 0.26%).
DemographicsRating | RankUnemployment Among Women with Children Ages 6 to 17 years
Immigrants from Ethiopia
89.5
/100
|
#138
Excellent
8.8%
Northern Europeans
89.2
/100
|
#139
Excellent
8.8%
Immigrants from Poland
88.3
/100
|
#140
Excellent
8.8%
Serbians
87.6
/100
|
#141
Excellent
8.8%
Immigrants from Austria
87.5
/100
|
#142
Excellent
8.8%
Immigrants from Kenya
86.1
/100
|
#143
Excellent
8.8%
Russians
85.8
/100
|
#144
Excellent
8.8%
Kenyans
85.6
/100
|
#145
Excellent
8.8%
Chileans
80.8
/100
|
#146
Excellent
8.8%
Immigrants from Bangladesh
79.4
/100
|
#147
Good
8.8%
Costa Ricans
77.0
/100
|
#148
Good
8.8%
Croatians
76.0
/100
|
#149
Good
8.8%
Greeks
75.2
/100
|
#150
Good
8.9%
Immigrants from Eastern Africa
74.6
/100
|
#151
Good
8.9%
Immigrants from Northern Europe
74.6
/100
|
#152
Good
8.9%

Kenyan Unemployment Among Women with Children Ages 6 to 17 years Correlation Summary

MeasurementKenyan DataUnemployment Among Women with Children Ages 6 to 17 years Data
Minimum0.037%5.6%
Maximum4.8%22.7%
Range4.7%17.1%
Mean1.4%10.8%
Median1.3%9.3%
Interquartile 25% (IQ1)0.61%8.5%
Interquartile 75% (IQ3)2.0%12.3%
Interquartile Range (IQR)1.4%3.9%
Standard Deviation (Sample)1.1%4.2%
Standard Deviation (Population)1.1%4.1%

Correlation Details

Kenyan PercentileSample SizeUnemployment Among Women with Children Ages 6 to 17 years
[
0.0%
-
0.5%
]
0.037%
112,035,2697.7%
[
0.0%
-
0.5%
]
0.17%
16,199,6718.5%
[
0.0%
-
0.5%
]
0.30%
5,882,1388.8%
[
0.0%
-
0.5%
]
0.44%
3,156,20010.6%
[
0.5%
-
1.0%
]
0.55%
1,612,5309.7%
[
0.5%
-
1.0%
]
0.67%
826,5208.9%
[
0.5%
-
1.0%
]
0.81%
528,2758.9%
[
0.5%
-
1.0%
]
0.89%
206,8897.0%
[
1.0%
-
1.5%
]
1.05%
98,21212.6%
[
1.0%
-
1.5%
]
1.20%
210,8639.4%
[
1.0%
-
1.5%
]
1.32%
116,8279.3%
[
1.0%
-
1.5%
]
1.41%
140,2599.3%
[
1.5%
-
2.0%
]
1.57%
162,1755.6%
[
1.5%
-
2.0%
]
1.70%
69,68712.1%
[
1.5%
-
2.0%
]
1.95%
127,92913.4%
[
2.0%
-
2.5%
]
2.04%
35,36618.7%
[
2.0%
-
2.5%
]
2.17%
72,2658.5%
[
2.0%
-
2.5%
]
2.34%
35,1848.4%
[
2.0%
-
2.5%
]
2.43%
1,48222.7%
[
4.5%
-
5.0%
]
4.77%
9,33216.1%