Iraqi Married-Couple Family Poverty
COMPARE
Iraqi
Select to Compare
Married-Couple Family Poverty
Iraqi Married-Couple Family Poverty
5.9%
POVERTY | MARRIED-COUPLE FAMILIES
1.4/ 100
METRIC RATING
247th/ 347
METRIC RANK
Iraqi Married-Couple Family Poverty Correlation Chart
The statistical analysis conducted on geographies consisting of 170,086,919 people shows a mild positive correlation between the proportion of Iraqis and poverty level among married-couple families in the United States with a correlation coefficient (R) of 0.391 and weighted average of 5.9%. On average, for every 1% (one percent) increase in Iraqis within a typical geography, there is an increase of 0.60% in poverty level among married-couple families.
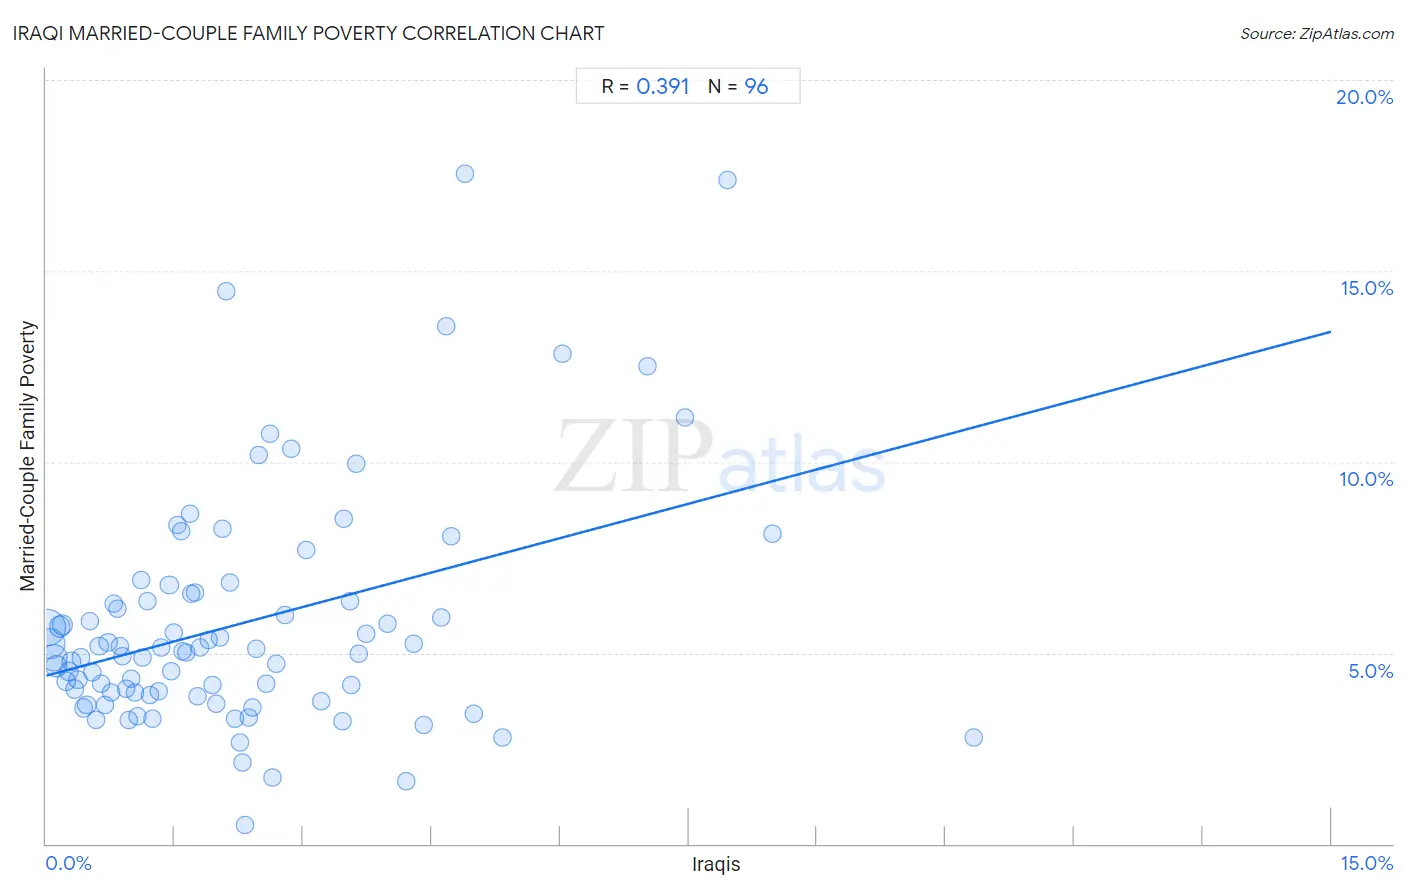
It is essential to understand that the correlation between the percentage of Iraqis and poverty level among married-couple families does not imply a direct cause-and-effect relationship. It remains uncertain whether the presence of Iraqis influences an upward or downward trend in the level of poverty level among married-couple families within an area, or if Iraqis simply ended up residing in those areas with higher or lower levels of poverty level among married-couple families due to other factors.
Demographics Similar to Iraqis by Married-Couple Family Poverty
In terms of married-couple family poverty, the demographic groups most similar to Iraqis are Cree (5.9%, a difference of 0.42%), Tsimshian (5.9%, a difference of 0.52%), Immigrants from Venezuela (5.8%, a difference of 0.62%), Immigrants from Eritrea (5.9%, a difference of 0.74%), and Immigrants from Ghana (5.9%, a difference of 0.99%).
| Demographics | Rating | Rank | Married-Couple Family Poverty |
| Fijians | 2.5 /100 | #240 | Tragic 5.8% |
| Immigrants from Panama | 2.5 /100 | #241 | Tragic 5.8% |
| Immigrants from Western Africa | 2.4 /100 | #242 | Tragic 5.8% |
| Somalis | 2.3 /100 | #243 | Tragic 5.8% |
| Chickasaw | 2.3 /100 | #244 | Tragic 5.8% |
| Immigrants from Afghanistan | 2.1 /100 | #245 | Tragic 5.8% |
| Immigrants from Venezuela | 1.8 /100 | #246 | Tragic 5.8% |
| Iraqis | 1.4 /100 | #247 | Tragic 5.9% |
| Cree | 1.2 /100 | #248 | Tragic 5.9% |
| Tsimshian | 1.1 /100 | #249 | Tragic 5.9% |
| Immigrants from Eritrea | 1.1 /100 | #250 | Tragic 5.9% |
| Immigrants from Ghana | 1.0 /100 | #251 | Tragic 5.9% |
| Immigrants from Western Asia | 0.7 /100 | #252 | Tragic 6.0% |
| Africans | 0.7 /100 | #253 | Tragic 6.0% |
| Immigrants from Somalia | 0.7 /100 | #254 | Tragic 6.0% |
Iraqi Married-Couple Family Poverty Correlation Summary
| Measurement | Iraqi Data | Married-Couple Family Poverty Data |
| Minimum | 0.019% | 0.50% |
| Maximum | 10.8% | 17.6% |
| Range | 10.8% | 17.1% |
| Mean | 2.3% | 5.8% |
| Median | 1.8% | 5.0% |
| Interquartile 25% (IQ1) | 0.84% | 3.9% |
| Interquartile 75% (IQ3) | 3.1% | 6.5% |
| Interquartile Range (IQR) | 2.3% | 2.5% |
| Standard Deviation (Sample) | 2.0% | 3.1% |
| Standard Deviation (Population) | 2.0% | 3.1% |
Correlation Details
| Iraqi Percentile | Sample Size | Married-Couple Family Poverty |
[ 0.0% - 0.5% ] 0.019% | 54,080,282 | 5.7% |
[ 0.0% - 0.5% ] 0.049% | 36,516,794 | 5.3% |
[ 0.0% - 0.5% ] 0.086% | 24,011,210 | 4.9% |
[ 0.0% - 0.5% ] 0.12% | 10,886,865 | 4.6% |
[ 0.0% - 0.5% ] 0.16% | 8,550,955 | 5.7% |
[ 0.0% - 0.5% ] 0.19% | 7,976,402 | 5.7% |
[ 0.0% - 0.5% ] 0.23% | 3,885,718 | 4.2% |
[ 0.0% - 0.5% ] 0.26% | 3,063,874 | 4.5% |
[ 0.0% - 0.5% ] 0.30% | 3,024,805 | 4.8% |
[ 0.0% - 0.5% ] 0.33% | 1,879,565 | 4.1% |
[ 0.0% - 0.5% ] 0.37% | 1,602,936 | 4.3% |
[ 0.0% - 0.5% ] 0.40% | 1,957,578 | 4.9% |
[ 0.0% - 0.5% ] 0.44% | 998,572 | 3.6% |
[ 0.0% - 0.5% ] 0.47% | 851,190 | 3.6% |
[ 0.5% - 1.0% ] 0.51% | 759,550 | 5.8% |
[ 0.5% - 1.0% ] 0.54% | 812,030 | 4.5% |
[ 0.5% - 1.0% ] 0.58% | 634,091 | 3.3% |
[ 0.5% - 1.0% ] 0.62% | 714,637 | 5.2% |
[ 0.5% - 1.0% ] 0.65% | 472,607 | 4.2% |
[ 0.5% - 1.0% ] 0.68% | 199,139 | 3.6% |
[ 0.5% - 1.0% ] 0.72% | 455,139 | 5.3% |
[ 0.5% - 1.0% ] 0.76% | 509,707 | 4.0% |
[ 0.5% - 1.0% ] 0.78% | 357,366 | 6.3% |
[ 0.5% - 1.0% ] 0.83% | 373,998 | 6.1% |
[ 0.5% - 1.0% ] 0.86% | 572,582 | 5.2% |
[ 0.5% - 1.0% ] 0.89% | 348,269 | 4.9% |
[ 0.5% - 1.0% ] 0.93% | 116,639 | 4.1% |
[ 0.5% - 1.0% ] 0.97% | 129,825 | 3.2% |
[ 0.5% - 1.0% ] 0.99% | 199,235 | 4.3% |
[ 1.0% - 1.5% ] 1.03% | 109,833 | 4.0% |
[ 1.0% - 1.5% ] 1.07% | 187,564 | 3.3% |
[ 1.0% - 1.5% ] 1.11% | 164,461 | 6.9% |
[ 1.0% - 1.5% ] 1.13% | 35,988 | 4.9% |
[ 1.0% - 1.5% ] 1.18% | 272,158 | 6.4% |
[ 1.0% - 1.5% ] 1.21% | 155,660 | 3.9% |
[ 1.0% - 1.5% ] 1.24% | 138,598 | 3.3% |
[ 1.0% - 1.5% ] 1.31% | 54,393 | 4.0% |
[ 1.0% - 1.5% ] 1.34% | 87,744 | 5.1% |
[ 1.0% - 1.5% ] 1.44% | 57,825 | 6.8% |
[ 1.0% - 1.5% ] 1.46% | 76,757 | 4.5% |
[ 1.0% - 1.5% ] 1.49% | 182,183 | 5.5% |
[ 1.5% - 2.0% ] 1.53% | 394,812 | 8.3% |
[ 1.5% - 2.0% ] 1.57% | 121,760 | 8.2% |
[ 1.5% - 2.0% ] 1.59% | 43,269 | 5.1% |
[ 1.5% - 2.0% ] 1.63% | 87,019 | 5.0% |
[ 1.5% - 2.0% ] 1.67% | 7,534 | 8.7% |
[ 1.5% - 2.0% ] 1.70% | 33,375 | 6.6% |
[ 1.5% - 2.0% ] 1.73% | 35,415 | 6.6% |
[ 1.5% - 2.0% ] 1.77% | 153,050 | 3.9% |
[ 1.5% - 2.0% ] 1.80% | 44,873 | 5.1% |
[ 1.5% - 2.0% ] 1.90% | 40,923 | 5.3% |
[ 1.5% - 2.0% ] 1.94% | 57,516 | 4.2% |
[ 1.5% - 2.0% ] 1.99% | 34,758 | 3.7% |
[ 2.0% - 2.5% ] 2.02% | 29,673 | 5.4% |
[ 2.0% - 2.5% ] 2.06% | 76,047 | 8.2% |
[ 2.0% - 2.5% ] 2.10% | 38,624 | 14.5% |
[ 2.0% - 2.5% ] 2.15% | 6,525 | 6.8% |
[ 2.0% - 2.5% ] 2.20% | 26,710 | 3.3% |
[ 2.0% - 2.5% ] 2.26% | 42,439 | 2.6% |
[ 2.0% - 2.5% ] 2.29% | 19,289 | 2.1% |
[ 2.0% - 2.5% ] 2.33% | 34,222 | 0.50% |
[ 2.0% - 2.5% ] 2.37% | 23,867 | 3.3% |
[ 2.0% - 2.5% ] 2.41% | 22,914 | 3.6% |
[ 2.0% - 2.5% ] 2.45% | 34,375 | 5.1% |
[ 2.0% - 2.5% ] 2.49% | 22,082 | 10.2% |
[ 2.5% - 3.0% ] 2.57% | 17,007 | 4.2% |
[ 2.5% - 3.0% ] 2.61% | 29,075 | 10.7% |
[ 2.5% - 3.0% ] 2.64% | 61,381 | 1.7% |
[ 2.5% - 3.0% ] 2.68% | 78,461 | 4.7% |
[ 2.5% - 3.0% ] 2.78% | 30,590 | 6.0% |
[ 2.5% - 3.0% ] 2.86% | 105 | 10.3% |
[ 3.0% - 3.5% ] 3.03% | 15,387 | 7.7% |
[ 3.0% - 3.5% ] 3.22% | 45,692 | 3.7% |
[ 3.0% - 3.5% ] 3.45% | 14,997 | 3.2% |
[ 3.0% - 3.5% ] 3.48% | 27,848 | 8.5% |
[ 3.5% - 4.0% ] 3.54% | 16,469 | 6.3% |
[ 3.5% - 4.0% ] 3.56% | 34,921 | 4.1% |
[ 3.5% - 4.0% ] 3.62% | 15,017 | 9.9% |
[ 3.5% - 4.0% ] 3.65% | 1,368 | 5.0% |
[ 3.5% - 4.0% ] 3.74% | 4,092 | 5.5% |
[ 3.5% - 4.0% ] 3.98% | 6,607 | 5.8% |
[ 4.0% - 4.5% ] 4.20% | 15,826 | 1.7% |
[ 4.0% - 4.5% ] 4.28% | 45,937 | 5.2% |
[ 4.0% - 4.5% ] 4.40% | 16,850 | 3.1% |
[ 4.5% - 5.0% ] 4.61% | 147,500 | 5.9% |
[ 4.5% - 5.0% ] 4.67% | 214 | 13.6% |
[ 4.5% - 5.0% ] 4.73% | 69,638 | 8.0% |
[ 4.5% - 5.0% ] 4.89% | 108,414 | 17.6% |
[ 4.5% - 5.0% ] 4.99% | 22,430 | 3.4% |
[ 5.0% - 5.5% ] 5.33% | 3,788 | 2.8% |
[ 6.0% - 6.5% ] 6.02% | 79,216 | 12.8% |
[ 7.0% - 7.5% ] 7.02% | 105,721 | 12.5% |
[ 7.0% - 7.5% ] 7.46% | 59,775 | 11.2% |
[ 7.5% - 8.0% ] 7.95% | 40,392 | 17.4% |
[ 8.0% - 8.5% ] 8.48% | 43,232 | 8.1% |
[ 10.5% - 11.0% ] 10.82% | 33,174 | 2.8% |