Iraqi Unemployment Among Women with Children Ages 6 to 17 years
COMPARE
Iraqi
Select to Compare
Unemployment Among Women with Children Ages 6 to 17 years
Iraqi Unemployment Among Women with Children Ages 6 to 17 years
8.4%
UNEMPLOYMENT | WOMEN W/ CHILDREN 6 TO 17
99.7/ 100
METRIC RATING
77th/ 347
METRIC RANK
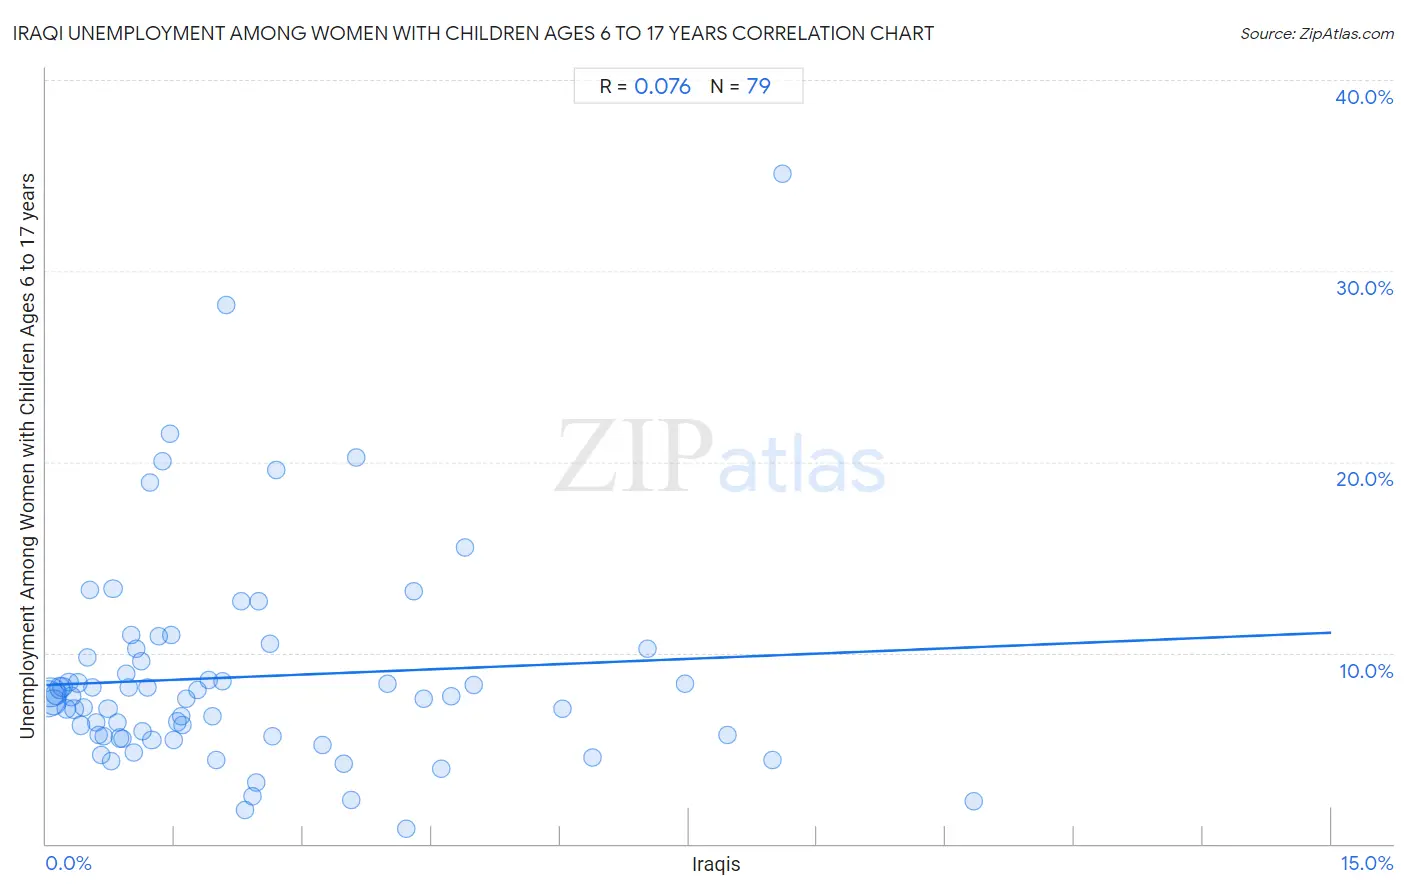
Iraqi Unemployment Among Women with Children Ages 6 to 17 years Correlation Chart
The statistical analysis conducted on geographies consisting of 141,144,202 people shows a slight positive correlation between the proportion of Iraqis and unemployment rate among women with children between the ages 6 and 17 in the United States with a correlation coefficient (R) of 0.076 and weighted average of 8.4%. On average, for every 1% (one percent) increase in Iraqis within a typical geography, there is an increase of 0.18% in unemployment rate among women with children between the ages 6 and 17.
It is essential to understand that the correlation between the percentage of Iraqis and unemployment rate among women with children between the ages 6 and 17 does not imply a direct cause-and-effect relationship. It remains uncertain whether the presence of Iraqis influences an upward or downward trend in the level of unemployment rate among women with children between the ages 6 and 17 within an area, or if Iraqis simply ended up residing in those areas with higher or lower levels of unemployment rate among women with children between the ages 6 and 17 due to other factors.
Demographics Similar to Iraqis by Unemployment Among Women with Children Ages 6 to 17 years
In terms of unemployment among women with children ages 6 to 17 years, the demographic groups most similar to Iraqis are Immigrants from Moldova (8.4%, a difference of 0.050%), Immigrants from Sri Lanka (8.4%, a difference of 0.080%), Pakistani (8.4%, a difference of 0.14%), Mongolian (8.4%, a difference of 0.15%), and Samoan (8.4%, a difference of 0.16%).
| Demographics | Rating | Rank | Unemployment Among Women with Children Ages 6 to 17 years |
| Norwegians | 99.9 /100 | #70 | Exceptional 8.3% |
| Immigrants from Australia | 99.8 /100 | #71 | Exceptional 8.3% |
| Immigrants from Nepal | 99.8 /100 | #72 | Exceptional 8.3% |
| Spanish Americans | 99.8 /100 | #73 | Exceptional 8.4% |
| Samoans | 99.7 /100 | #74 | Exceptional 8.4% |
| Immigrants from Sri Lanka | 99.7 /100 | #75 | Exceptional 8.4% |
| Immigrants from Moldova | 99.7 /100 | #76 | Exceptional 8.4% |
| Iraqis | 99.7 /100 | #77 | Exceptional 8.4% |
| Pakistanis | 99.6 /100 | #78 | Exceptional 8.4% |
| Mongolians | 99.6 /100 | #79 | Exceptional 8.4% |
| Immigrants from Belarus | 99.6 /100 | #80 | Exceptional 8.4% |
| Immigrants from Bolivia | 99.6 /100 | #81 | Exceptional 8.4% |
| Cypriots | 99.6 /100 | #82 | Exceptional 8.4% |
| Bulgarians | 99.5 /100 | #83 | Exceptional 8.4% |
| Japanese | 99.5 /100 | #84 | Exceptional 8.4% |
Iraqi Unemployment Among Women with Children Ages 6 to 17 years Correlation Summary
| Measurement | Iraqi Data | Unemployment Among Women with Children Ages 6 to 17 years Data |
| Minimum | 0.019% | 0.80% |
| Maximum | 10.8% | 35.1% |
| Range | 10.8% | 34.3% |
| Mean | 2.3% | 8.7% |
| Median | 1.5% | 7.6% |
| Interquartile 25% (IQ1) | 0.68% | 5.6% |
| Interquartile 75% (IQ3) | 3.2% | 9.8% |
| Interquartile Range (IQR) | 2.5% | 4.2% |
| Standard Deviation (Sample) | 2.3% | 5.6% |
| Standard Deviation (Population) | 2.3% | 5.6% |
Correlation Details
| Iraqi Percentile | Sample Size | Unemployment Among Women with Children Ages 6 to 17 years |
[ 0.0% - 0.5% ] 0.019% | 48,715,220 | 7.6% |
[ 0.0% - 0.5% ] 0.048% | 30,204,497 | 7.9% |
[ 0.0% - 0.5% ] 0.086% | 20,419,520 | 7.4% |
[ 0.0% - 0.5% ] 0.12% | 8,970,983 | 7.8% |
[ 0.0% - 0.5% ] 0.16% | 7,005,290 | 8.2% |
[ 0.0% - 0.5% ] 0.19% | 6,278,482 | 8.2% |
[ 0.0% - 0.5% ] 0.23% | 2,929,727 | 7.1% |
[ 0.0% - 0.5% ] 0.26% | 2,073,124 | 8.5% |
[ 0.0% - 0.5% ] 0.30% | 1,994,527 | 7.7% |
[ 0.0% - 0.5% ] 0.33% | 1,114,921 | 7.0% |
[ 0.0% - 0.5% ] 0.37% | 1,225,549 | 8.4% |
[ 0.0% - 0.5% ] 0.40% | 1,533,922 | 6.2% |
[ 0.0% - 0.5% ] 0.44% | 570,293 | 7.1% |
[ 0.0% - 0.5% ] 0.48% | 569,208 | 9.8% |
[ 0.5% - 1.0% ] 0.51% | 506,005 | 13.3% |
[ 0.5% - 1.0% ] 0.54% | 615,672 | 8.2% |
[ 0.5% - 1.0% ] 0.58% | 387,596 | 6.4% |
[ 0.5% - 1.0% ] 0.62% | 443,046 | 5.7% |
[ 0.5% - 1.0% ] 0.65% | 292,509 | 4.7% |
[ 0.5% - 1.0% ] 0.68% | 116,878 | 5.7% |
[ 0.5% - 1.0% ] 0.72% | 239,817 | 7.1% |
[ 0.5% - 1.0% ] 0.76% | 473,834 | 4.3% |
[ 0.5% - 1.0% ] 0.78% | 232,107 | 13.4% |
[ 0.5% - 1.0% ] 0.83% | 251,839 | 6.3% |
[ 0.5% - 1.0% ] 0.86% | 506,177 | 5.5% |
[ 0.5% - 1.0% ] 0.89% | 197,374 | 5.5% |
[ 0.5% - 1.0% ] 0.93% | 76,203 | 8.9% |
[ 0.5% - 1.0% ] 0.96% | 89,029 | 8.2% |
[ 0.5% - 1.0% ] 0.99% | 130,010 | 10.9% |
[ 1.0% - 1.5% ] 1.02% | 37,106 | 4.8% |
[ 1.0% - 1.5% ] 1.06% | 59,225 | 10.2% |
[ 1.0% - 1.5% ] 1.11% | 153,873 | 9.6% |
[ 1.0% - 1.5% ] 1.13% | 28,639 | 5.9% |
[ 1.0% - 1.5% ] 1.18% | 144,098 | 8.2% |
[ 1.0% - 1.5% ] 1.21% | 45,796 | 18.9% |
[ 1.0% - 1.5% ] 1.23% | 79,003 | 5.4% |
[ 1.0% - 1.5% ] 1.31% | 49,820 | 10.9% |
[ 1.0% - 1.5% ] 1.35% | 41,524 | 20.0% |
[ 1.0% - 1.5% ] 1.44% | 57,042 | 21.5% |
[ 1.0% - 1.5% ] 1.46% | 59,889 | 11.0% |
[ 1.0% - 1.5% ] 1.49% | 163,626 | 5.5% |
[ 1.5% - 2.0% ] 1.53% | 326,683 | 6.4% |
[ 1.5% - 2.0% ] 1.57% | 98,243 | 6.7% |
[ 1.5% - 2.0% ] 1.59% | 30,864 | 6.2% |
[ 1.5% - 2.0% ] 1.63% | 77,612 | 7.6% |
[ 1.5% - 2.0% ] 1.76% | 112,892 | 8.0% |
[ 1.5% - 2.0% ] 1.90% | 40,923 | 8.6% |
[ 1.5% - 2.0% ] 1.94% | 22,163 | 6.7% |
[ 1.5% - 2.0% ] 1.99% | 34,758 | 4.4% |
[ 2.0% - 2.5% ] 2.06% | 36,493 | 8.5% |
[ 2.0% - 2.5% ] 2.10% | 38,624 | 28.2% |
[ 2.0% - 2.5% ] 2.27% | 18,814 | 12.7% |
[ 2.0% - 2.5% ] 2.33% | 34,222 | 1.8% |
[ 2.0% - 2.5% ] 2.41% | 19,975 | 2.5% |
[ 2.0% - 2.5% ] 2.45% | 34,004 | 3.2% |
[ 2.0% - 2.5% ] 2.49% | 22,082 | 12.7% |
[ 2.5% - 3.0% ] 2.61% | 18,393 | 10.5% |
[ 2.5% - 3.0% ] 2.64% | 57,510 | 5.6% |
[ 2.5% - 3.0% ] 2.68% | 76,600 | 19.6% |
[ 3.0% - 3.5% ] 3.22% | 23,540 | 5.2% |
[ 3.0% - 3.5% ] 3.48% | 27,848 | 4.2% |
[ 3.5% - 4.0% ] 3.56% | 34,921 | 2.3% |
[ 3.5% - 4.0% ] 3.62% | 15,017 | 20.2% |
[ 3.5% - 4.0% ] 3.98% | 6,607 | 8.4% |
[ 4.0% - 4.5% ] 4.20% | 15,826 | 0.80% |
[ 4.0% - 4.5% ] 4.28% | 45,937 | 13.2% |
[ 4.0% - 4.5% ] 4.40% | 16,850 | 7.6% |
[ 4.5% - 5.0% ] 4.61% | 147,500 | 4.0% |
[ 4.5% - 5.0% ] 4.73% | 69,638 | 7.7% |
[ 4.5% - 5.0% ] 4.89% | 108,414 | 15.5% |
[ 4.5% - 5.0% ] 4.99% | 22,430 | 8.3% |
[ 6.0% - 6.5% ] 6.02% | 79,216 | 7.1% |
[ 6.0% - 6.5% ] 6.38% | 11,265 | 4.5% |
[ 7.0% - 7.5% ] 7.02% | 105,721 | 10.2% |
[ 7.0% - 7.5% ] 7.46% | 59,775 | 8.4% |
[ 7.5% - 8.0% ] 7.95% | 40,392 | 5.7% |
[ 8.0% - 8.5% ] 8.48% | 43,232 | 4.4% |
[ 8.5% - 9.0% ] 8.60% | 53,044 | 35.1% |
[ 10.5% - 11.0% ] 10.82% | 33,174 | 2.2% |