Immigrants from Zimbabwe Disability
COMPARE
Immigrants from Zimbabwe
Select to Compare
Disability
Immigrants from Zimbabwe Disability
11.2%
DISABILITY
97.7/ 100
METRIC RATING
96th/ 347
METRIC RANK
Immigrants from Zimbabwe Disability Correlation Chart
The statistical analysis conducted on geographies consisting of 117,811,859 people shows a substantial positive correlation between the proportion of Immigrants from Zimbabwe and percentage of population with a disability in the United States with a correlation coefficient (R) of 0.518 and weighted average of 11.2%. On average, for every 1% (one percent) increase in Immigrants from Zimbabwe within a typical geography, there is an increase of 1.2% in percentage of population with a disability.
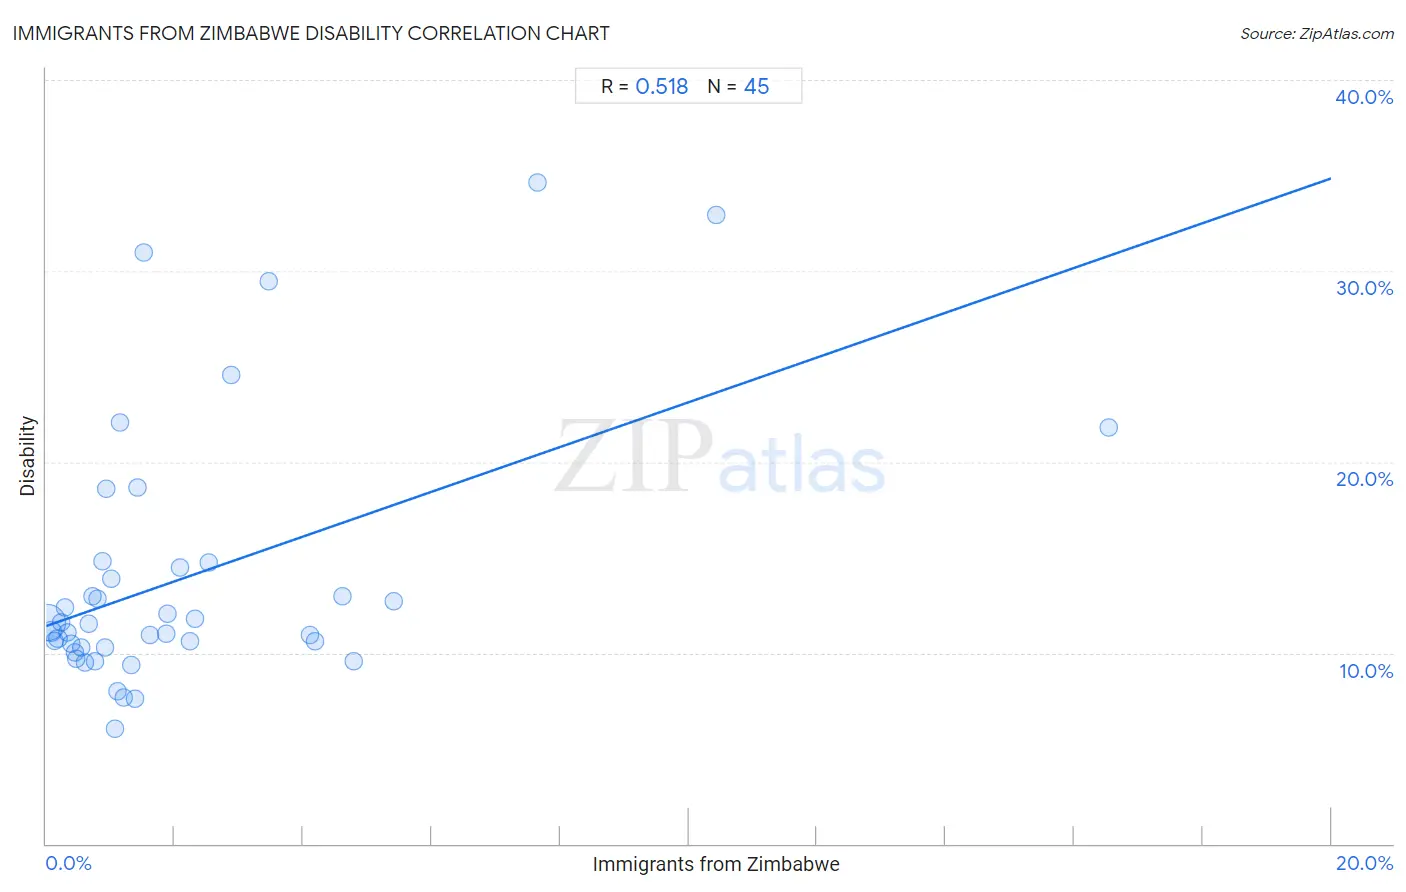
It is essential to understand that the correlation between the percentage of Immigrants from Zimbabwe and percentage of population with a disability does not imply a direct cause-and-effect relationship. It remains uncertain whether the presence of Immigrants from Zimbabwe influences an upward or downward trend in the level of percentage of population with a disability within an area, or if Immigrants from Zimbabwe simply ended up residing in those areas with higher or lower levels of percentage of population with a disability due to other factors.
Demographics Similar to Immigrants from Zimbabwe by Disability
In terms of disability, the demographic groups most similar to Immigrants from Zimbabwe are Eastern European (11.2%, a difference of 0.060%), Immigrants from Morocco (11.2%, a difference of 0.070%), Bhutanese (11.2%, a difference of 0.14%), Uruguayan (11.2%, a difference of 0.14%), and Immigrants from Czechoslovakia (11.2%, a difference of 0.15%).
| Demographics | Rating | Rank | Disability |
| Immigrants from South Africa | 98.2 /100 | #89 | Exceptional 11.2% |
| Immigrants from Brazil | 98.1 /100 | #90 | Exceptional 11.2% |
| Immigrants from Western Asia | 98.1 /100 | #91 | Exceptional 11.2% |
| Ecuadorians | 98.0 /100 | #92 | Exceptional 11.2% |
| Immigrants from Ecuador | 98.0 /100 | #93 | Exceptional 11.2% |
| Immigrants from Morocco | 97.8 /100 | #94 | Exceptional 11.2% |
| Eastern Europeans | 97.8 /100 | #95 | Exceptional 11.2% |
| Immigrants from Zimbabwe | 97.7 /100 | #96 | Exceptional 11.2% |
| Bhutanese | 97.4 /100 | #97 | Exceptional 11.2% |
| Uruguayans | 97.4 /100 | #98 | Exceptional 11.2% |
| Immigrants from Czechoslovakia | 97.4 /100 | #99 | Exceptional 11.2% |
| Immigrants from Greece | 96.9 /100 | #100 | Exceptional 11.3% |
| Immigrants from Nicaragua | 96.8 /100 | #101 | Exceptional 11.3% |
| Immigrants from Eastern Africa | 96.7 /100 | #102 | Exceptional 11.3% |
| Immigrants from Uruguay | 96.4 /100 | #103 | Exceptional 11.3% |
Immigrants from Zimbabwe Disability Correlation Summary
| Measurement | Immigrants from Zimbabwe Data | Disability Data |
| Minimum | 0.017% | 6.0% |
| Maximum | 16.5% | 34.6% |
| Range | 16.5% | 28.6% |
| Mean | 2.2% | 14.0% |
| Median | 1.2% | 11.5% |
| Interquartile 25% (IQ1) | 0.58% | 10.3% |
| Interquartile 75% (IQ3) | 2.4% | 14.6% |
| Interquartile Range (IQR) | 1.9% | 4.3% |
| Standard Deviation (Sample) | 3.0% | 6.8% |
| Standard Deviation (Population) | 3.0% | 6.8% |
Correlation Details
| Immigrants from Zimbabwe Percentile | Sample Size | Disability |
[ 0.0% - 0.5% ] 0.017% | 96,590,807 | 11.6% |
[ 0.0% - 0.5% ] 0.074% | 11,551,653 | 11.1% |
[ 0.0% - 0.5% ] 0.13% | 3,964,784 | 10.6% |
[ 0.0% - 0.5% ] 0.18% | 2,089,314 | 10.7% |
[ 0.0% - 0.5% ] 0.23% | 885,379 | 11.6% |
[ 0.0% - 0.5% ] 0.29% | 670,593 | 12.4% |
[ 0.0% - 0.5% ] 0.33% | 478,711 | 11.1% |
[ 0.0% - 0.5% ] 0.39% | 338,678 | 10.5% |
[ 0.0% - 0.5% ] 0.45% | 355,667 | 10.0% |
[ 0.0% - 0.5% ] 0.48% | 94,478 | 9.7% |
[ 0.5% - 1.0% ] 0.55% | 235,275 | 10.3% |
[ 0.5% - 1.0% ] 0.61% | 83,805 | 9.5% |
[ 0.5% - 1.0% ] 0.66% | 42,362 | 11.5% |
[ 0.5% - 1.0% ] 0.71% | 39,523 | 13.0% |
[ 0.5% - 1.0% ] 0.76% | 76,479 | 9.5% |
[ 0.5% - 1.0% ] 0.79% | 53,714 | 12.8% |
[ 0.5% - 1.0% ] 0.88% | 13,719 | 14.8% |
[ 0.5% - 1.0% ] 0.91% | 61,732 | 10.3% |
[ 0.5% - 1.0% ] 0.94% | 3,935 | 18.6% |
[ 1.0% - 1.5% ] 1.02% | 32,114 | 13.8% |
[ 1.0% - 1.5% ] 1.06% | 4,790 | 6.0% |
[ 1.0% - 1.5% ] 1.11% | 31,316 | 8.0% |
[ 1.0% - 1.5% ] 1.16% | 4,413 | 22.1% |
[ 1.0% - 1.5% ] 1.20% | 916 | 7.6% |
[ 1.0% - 1.5% ] 1.33% | 18,115 | 9.4% |
[ 1.0% - 1.5% ] 1.38% | 4,773 | 7.6% |
[ 1.0% - 1.5% ] 1.43% | 3,572 | 18.7% |
[ 1.5% - 2.0% ] 1.52% | 197 | 31.0% |
[ 1.5% - 2.0% ] 1.62% | 26,607 | 10.9% |
[ 1.5% - 2.0% ] 1.86% | 1,664 | 11.0% |
[ 1.5% - 2.0% ] 1.88% | 1,221 | 12.0% |
[ 2.0% - 2.5% ] 2.08% | 3,801 | 14.5% |
[ 2.0% - 2.5% ] 2.23% | 20,716 | 10.6% |
[ 2.0% - 2.5% ] 2.32% | 18,077 | 11.8% |
[ 2.5% - 3.0% ] 2.54% | 197 | 14.7% |
[ 2.5% - 3.0% ] 2.88% | 208 | 24.5% |
[ 3.0% - 3.5% ] 3.47% | 173 | 29.5% |
[ 4.0% - 4.5% ] 4.10% | 1,513 | 10.9% |
[ 4.0% - 4.5% ] 4.19% | 2,961 | 10.6% |
[ 4.5% - 5.0% ] 4.62% | 1,473 | 13.0% |
[ 4.5% - 5.0% ] 4.78% | 209 | 9.6% |
[ 5.0% - 5.5% ] 5.42% | 1,366 | 12.7% |
[ 7.5% - 8.0% ] 7.64% | 419 | 34.6% |
[ 10.0% - 10.5% ] 10.42% | 307 | 32.9% |
[ 16.5% - 17.0% ] 16.54% | 133 | 21.8% |