Immigrants from Zimbabwe Married-Couple Family Poverty

COMPARE

Immigrants from Zimbabwe
Race
Ancestry
AfghanAfricanAlaska NativeAlaskan AthabascanAlbanianAleutAlsatianAmericanApacheArabArapahoArgentineanArmenianAssyrian/Chaldean/SyriacAustralianAustrianBahamianBangladeshiBarbadianBasqueBelgianBelizeanBermudanBhutaneseBlackfeetBolivianBrazilianBritishBritish West IndianBulgarianBurmeseCajunCambodianCanadianCape VerdeanCarpatho RusynCelticCentral AmericanCentral American IndianCherokeeCheyenneChickasawChileanChineseChippewaChoctawColombianColvilleComancheCosta RicanCreeCreekCroatianCrowCubanCypriotCzechCzechoslovakianDanishDelawareDominicanDutchDutch West IndianEastern EuropeanEcuadorianEgyptianEnglishEstonianEthiopianEuropeanFijianFilipinoFinnishFrenchFrench American IndianFrench CanadianGermanGerman RussianGhanaianGreekGuamanian/ChamorroGuatemalanGuyaneseHaitianHmongHonduranHopiHoumaHungarianIcelanderIndian (Asian)IndonesianInupiatIranianIraqiIrishIroquoisIsraeliItalianJamaicanJapaneseJordanianKenyanKiowaKoreanLaotianLatvianLebaneseLiberianLithuanianLumbeeLuxembourgerMacedonianMalaysianMalteseMarshalleseMenomineeMexicanMexican American IndianMongolianMoroccanNative HawaiianNavajoNepaleseNew ZealanderNicaraguanNigerianNorthern EuropeanNorwegianOkinawanOsageOttawaPaiutePakistaniPalestinianPanamanianParaguayanPennsylvania GermanPeruvianPimaPolishPortuguesePotawatomiPuebloPuerto RicanPuget Sound SalishRomanianRussianSalvadoranSamoanScandinavianScotch-IrishScottishSeminoleSenegaleseSerbianShoshoneSierra LeoneanSiouxSlavicSlovakSloveneSomaliSouth AfricanSouth AmericanSouth American IndianSoviet UnionSpaniardSpanishSpanish AmericanSpanish American IndianSri LankanSubsaharan AfricanSudaneseSwedishSwissSyrianTaiwaneseThaiTlingit-HaidaTohono O'OdhamTonganTrinidadian and TobagonianTsimshianTurkishU.S. Virgin IslanderUgandanUkrainianUruguayanUteVenezuelanVietnameseWelshWest IndianYakamaYaquiYugoslavianYumanYup'ikZimbabwean
Immigration
NonimmigrantsImmigrantsAfghanistanAfricaAlbaniaArgentinaArmeniaAsiaAustraliaAustriaBahamasBangladeshBarbadosBelarusBelgiumBelizeBoliviaBosnia and HerzegovinaBrazilBulgariaBurma/MyanmarCabo VerdeCambodiaCameroonCanadaCaribbeanCentral AmericaChileChinaColombiaCongoCosta RicaCroatiaCubaCzechoslovakiaDenmarkDominicaDominican RepublicEastern AfricaEastern AsiaEastern EuropeEcuadorEgyptEl SalvadorEnglandEritreaEthiopiaEuropeFijiFranceGermanyGhanaGreeceGrenadaGuatemalaGuyanaHaitiHondurasHong KongHungaryIndiaIndonesiaIranIraqIrelandIsraelItalyJamaicaJapanJordanKazakhstanKenyaKoreaKuwaitLaosLatin AmericaLatviaLebanonLiberiaLithuaniaMalaysiaMexicoMicronesiaMiddle AfricaMoldovaMoroccoNepalNetherlandsNicaraguaNigeriaNorth AmericaNorth MacedoniaNorthern AfricaNorthern EuropeNorwayOceaniaPakistanPanamaPeruPhilippinesPolandPortugalRomaniaRussiaSaudi ArabiaScotlandSenegalSerbiaSierra LeoneSingaporeSomaliaSouth AfricaSouth AmericaSouth Central AsiaSouth Eastern AsiaSouthern EuropeSpainSri LankaSt. Vincent and the GrenadinesSudanSwedenSwitzerlandSyriaTaiwanThailandTrinidad and TobagoTurkeyUgandaUkraineUruguayUzbekistanVenezuelaVietnamWest IndiesWestern AfricaWestern AsiaWestern EuropeYemenZaireZimbabweAzores
Select to Compare
Race
Ancestry
AfghanAfricanAlaska NativeAlaskan AthabascanAlbanianAleutAlsatianAmericanApacheArabArapahoArgentineanArmenianAssyrian/Chaldean/SyriacAustralianAustrianBahamianBangladeshiBarbadianBasqueBelgianBelizeanBermudanBhutaneseBlackfeetBolivianBrazilianBritishBritish West IndianBulgarianBurmeseCajunCambodianCanadianCape VerdeanCarpatho RusynCelticCentral AmericanCentral American IndianCherokeeCheyenneChickasawChileanChineseChippewaChoctawColombianColvilleComancheCosta RicanCreeCreekCroatianCrowCubanCypriotCzechCzechoslovakianDanishDelawareDominicanDutchDutch West IndianEastern EuropeanEcuadorianEgyptianEnglishEstonianEthiopianEuropeanFijianFilipinoFinnishFrenchFrench American IndianFrench CanadianGermanGerman RussianGhanaianGreekGuamanian/ChamorroGuatemalanGuyaneseHaitianHmongHonduranHopiHoumaHungarianIcelanderIndian (Asian)IndonesianInupiatIranianIraqiIrishIroquoisIsraeliItalianJamaicanJapaneseJordanianKenyanKiowaKoreanLaotianLatvianLebaneseLiberianLithuanianLumbeeLuxembourgerMacedonianMalaysianMalteseMarshalleseMenomineeMexicanMexican American IndianMongolianMoroccanNative HawaiianNavajoNepaleseNew ZealanderNicaraguanNigerianNorthern EuropeanNorwegianOkinawanOsageOttawaPaiutePakistaniPalestinianPanamanianParaguayanPennsylvania GermanPeruvianPimaPolishPortuguesePotawatomiPuebloPuerto RicanPuget Sound SalishRomanianRussianSalvadoranSamoanScandinavianScotch-IrishScottishSeminoleSenegaleseSerbianShoshoneSierra LeoneanSiouxSlavicSlovakSloveneSomaliSouth AfricanSouth AmericanSouth American IndianSoviet UnionSpaniardSpanishSpanish AmericanSpanish American IndianSri LankanSubsaharan AfricanSudaneseSwedishSwissSyrianTaiwaneseThaiTlingit-HaidaTohono O'OdhamTonganTrinidadian and TobagonianTsimshianTurkishU.S. Virgin IslanderUgandanUkrainianUruguayanUteVenezuelanVietnameseWelshWest IndianYakamaYaquiYugoslavianYumanYup'ikZimbabwean
Immigration
NonimmigrantsImmigrantsAfghanistanAfricaAlbaniaArgentinaArmeniaAsiaAustraliaAustriaBahamasBangladeshBarbadosBelarusBelgiumBelizeBoliviaBosnia and HerzegovinaBrazilBulgariaBurma/MyanmarCabo VerdeCambodiaCameroonCanadaCaribbeanCentral AmericaChileChinaColombiaCongoCosta RicaCroatiaCubaCzechoslovakiaDenmarkDominicaDominican RepublicEastern AfricaEastern AsiaEastern EuropeEcuadorEgyptEl SalvadorEnglandEritreaEthiopiaEuropeFijiFranceGermanyGhanaGreeceGrenadaGuatemalaGuyanaHaitiHondurasHong KongHungaryIndiaIndonesiaIranIraqIrelandIsraelItalyJamaicaJapanJordanKazakhstanKenyaKoreaKuwaitLaosLatin AmericaLatviaLebanonLiberiaLithuaniaMalaysiaMexicoMicronesiaMiddle AfricaMoldovaMoroccoNepalNetherlandsNicaraguaNigeriaNorth AmericaNorth MacedoniaNorthern AfricaNorthern EuropeNorwayOceaniaPakistanPanamaPeruPhilippinesPolandPortugalRomaniaRussiaSaudi ArabiaScotlandSenegalSerbiaSierra LeoneSingaporeSomaliaSouth AfricaSouth AmericaSouth Central AsiaSouth Eastern AsiaSouthern EuropeSpainSri LankaSt. Vincent and the GrenadinesSudanSwedenSwitzerlandSyriaTaiwanThailandTrinidad and TobagoTurkeyUgandaUkraineUruguayUzbekistanVenezuelaVietnamWest IndiesWestern AfricaWestern AsiaWestern EuropeYemenZaireAzores
Married-Couple Family Poverty
Income
Poverty
Unemployment
Labor Participation
Family Structure
Vehicle Availability
Education Level
Disability

Immigrants from Zimbabwe Married-Couple Family Poverty
Exceptional

4.3%
POVERTY | MARRIED-COUPLE FAMILIES
99.7/ 100
METRIC RATING
56th/ 347
METRIC RANK

Immigrants from Zimbabwe Married-Couple Family Poverty Correlation Chart

The statistical analysis conducted on geographies consisting of 117,574,773 people shows a slight positive correlation between the proportion of Immigrants from Zimbabwe and poverty level among married-couple families in the United States with a correlation coefficient (R) of 0.065 and weighted average of 4.3%. On average, for every 1% (one percent) increase in Immigrants from Zimbabwe within a typical geography, there is an increase of 0.071% in poverty level among married-couple families.
Immigrants from Zimbabwe Married-Couple Family Poverty
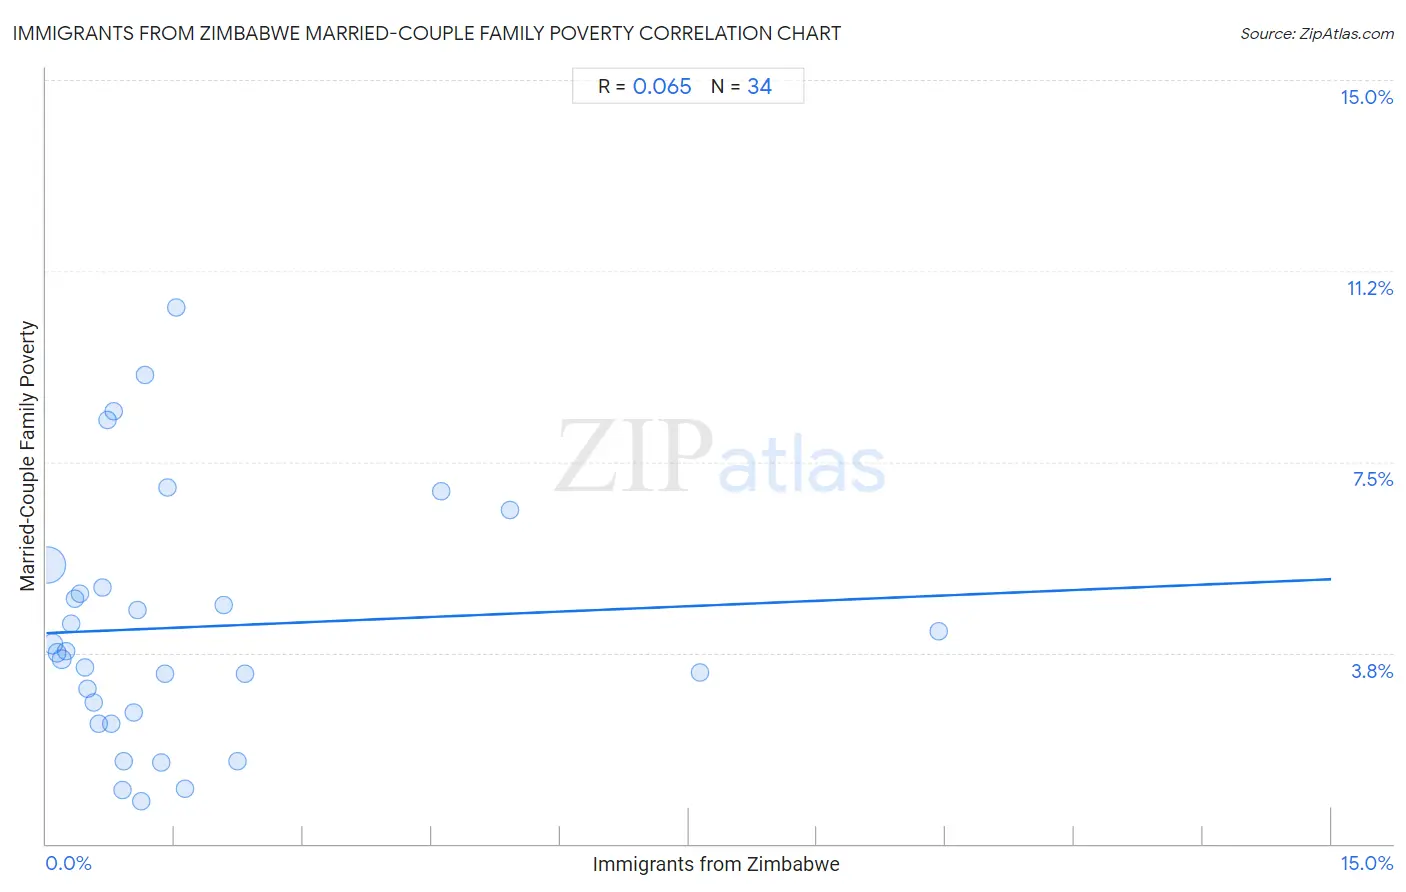
It is essential to understand that the correlation between the percentage of Immigrants from Zimbabwe and poverty level among married-couple families does not imply a direct cause-and-effect relationship. It remains uncertain whether the presence of Immigrants from Zimbabwe influences an upward or downward trend in the level of poverty level among married-couple families within an area, or if Immigrants from Zimbabwe simply ended up residing in those areas with higher or lower levels of poverty level among married-couple families due to other factors.

Demographics Similar to Immigrants from Zimbabwe by Married-Couple Family Poverty

In terms of married-couple family poverty, the demographic groups most similar to Immigrants from Zimbabwe are Immigrants from Netherlands (4.3%, a difference of 0.0%), Czechoslovakian (4.4%, a difference of 0.090%), French (4.3%, a difference of 0.16%), Austrian (4.3%, a difference of 0.18%), and Welsh (4.3%, a difference of 0.44%).
DemographicsRating | RankMarried-Couple Family Poverty
Turks
99.7
/100
|
#49
Exceptional
4.3%
Burmese
99.7
/100
|
#50
Exceptional
4.3%
Immigrants from Lithuania
99.7
/100
|
#51
Exceptional
4.3%
Russians
99.7
/100
|
#52
Exceptional
4.3%
Welsh
99.7
/100
|
#53
Exceptional
4.3%
Austrians
99.7
/100
|
#54
Exceptional
4.3%
French
99.7
/100
|
#55
Exceptional
4.3%
Immigrants from Zimbabwe
99.7
/100
|
#56
Exceptional
4.3%
Immigrants from Netherlands
99.7
/100
|
#57
Exceptional
4.3%
Czechoslovakians
99.7
/100
|
#58
Exceptional
4.4%
Immigrants from Sweden
99.6
/100
|
#59
Exceptional
4.4%
Tlingit-Haida
99.6
/100
|
#60
Exceptional
4.4%
Okinawans
99.6
/100
|
#61
Exceptional
4.4%
Immigrants from Australia
99.6
/100
|
#62
Exceptional
4.4%
Immigrants from Sri Lanka
99.6
/100
|
#63
Exceptional
4.4%

Immigrants from Zimbabwe Married-Couple Family Poverty Correlation Summary

MeasurementImmigrants from Zimbabwe DataMarried-Couple Family Poverty Data
Minimum0.017%0.84%
Maximum10.4%10.5%
Range10.4%9.7%
Mean1.6%4.3%
Median0.90%3.8%
Interquartile 25% (IQ1)0.45%2.6%
Interquartile 75% (IQ3)1.5%5.0%
Interquartile Range (IQR)1.1%2.5%
Standard Deviation (Sample)2.2%2.4%
Standard Deviation (Population)2.2%2.4%

Correlation Details

Immigrants from Zimbabwe PercentileSample SizeMarried-Couple Family Poverty
[
0.0%
-
0.5%
]
0.017%
96,551,8335.5%
[
0.0%
-
0.5%
]
0.074%
11,539,5753.9%
[
0.0%
-
0.5%
]
0.13%
3,894,3443.7%
[
0.0%
-
0.5%
]
0.18%
2,065,7713.6%
[
0.0%
-
0.5%
]
0.23%
875,4063.8%
[
0.0%
-
0.5%
]
0.29%
665,7724.3%
[
0.0%
-
0.5%
]
0.33%
471,9474.8%
[
0.0%
-
0.5%
]
0.39%
333,8594.9%
[
0.0%
-
0.5%
]
0.45%
344,5193.5%
[
0.0%
-
0.5%
]
0.48%
94,0793.1%
[
0.5%
-
1.0%
]
0.55%
233,0292.8%
[
0.5%
-
1.0%
]
0.61%
76,8762.4%
[
0.5%
-
1.0%
]
0.66%
42,3625.0%
[
0.5%
-
1.0%
]
0.71%
39,5238.3%
[
0.5%
-
1.0%
]
0.77%
73,1422.3%
[
0.5%
-
1.0%
]
0.79%
53,7148.5%
[
0.5%
-
1.0%
]
0.89%
9,7121.1%
[
0.5%
-
1.0%
]
0.91%
48,4921.6%
[
1.0%
-
1.5%
]
1.02%
32,1142.6%
[
1.0%
-
1.5%
]
1.06%
4,7904.6%
[
1.0%
-
1.5%
]
1.11%
27,5920.84%
[
1.0%
-
1.5%
]
1.16%
4,4139.2%
[
1.0%
-
1.5%
]
1.34%
13,1671.6%
[
1.0%
-
1.5%
]
1.38%
2,8243.3%
[
1.0%
-
1.5%
]
1.42%
2,9557.0%
[
1.5%
-
2.0%
]
1.52%
19710.5%
[
1.5%
-
2.0%
]
1.62%
26,6071.1%
[
2.0%
-
2.5%
]
2.08%
3,8014.7%
[
2.0%
-
2.5%
]
2.23%
20,7161.6%
[
2.0%
-
2.5%
]
2.32%
18,0773.3%
[
4.5%
-
5.0%
]
4.62%
1,4736.9%
[
5.0%
-
5.5%
]
5.42%
1,3666.6%
[
7.5%
-
8.0%
]
7.64%
4193.4%
[
10.0%
-
10.5%
]
10.42%
3074.2%