Immigrants from West Indies Wage/Income Gap

COMPARE

Immigrants from West Indies
Race
Ancestry
AfghanAfricanAlaska NativeAlaskan AthabascanAlbanianAleutAlsatianAmericanApacheArabArapahoArgentineanArmenianAssyrian/Chaldean/SyriacAustralianAustrianBahamianBangladeshiBarbadianBasqueBelgianBelizeanBermudanBhutaneseBlackfeetBolivianBrazilianBritishBritish West IndianBulgarianBurmeseCajunCambodianCanadianCape VerdeanCarpatho RusynCelticCentral AmericanCentral American IndianCherokeeCheyenneChickasawChileanChineseChippewaChoctawColombianColvilleComancheCosta RicanCreeCreekCroatianCrowCubanCypriotCzechCzechoslovakianDanishDelawareDominicanDutchDutch West IndianEastern EuropeanEcuadorianEgyptianEnglishEstonianEthiopianEuropeanFijianFilipinoFinnishFrenchFrench American IndianFrench CanadianGermanGerman RussianGhanaianGreekGuamanian/ChamorroGuatemalanGuyaneseHaitianHmongHonduranHopiHoumaHungarianIcelanderIndian (Asian)IndonesianInupiatIranianIraqiIrishIroquoisIsraeliItalianJamaicanJapaneseJordanianKenyanKiowaKoreanLaotianLatvianLebaneseLiberianLithuanianLumbeeLuxembourgerMacedonianMalaysianMalteseMarshalleseMenomineeMexicanMexican American IndianMongolianMoroccanNative HawaiianNavajoNepaleseNew ZealanderNicaraguanNigerianNorthern EuropeanNorwegianOkinawanOsageOttawaPaiutePakistaniPalestinianPanamanianParaguayanPennsylvania GermanPeruvianPimaPolishPortuguesePotawatomiPuebloPuerto RicanPuget Sound SalishRomanianRussianSalvadoranSamoanScandinavianScotch-IrishScottishSeminoleSenegaleseSerbianShoshoneSierra LeoneanSiouxSlavicSlovakSloveneSomaliSouth AfricanSouth AmericanSouth American IndianSoviet UnionSpaniardSpanishSpanish AmericanSpanish American IndianSri LankanSubsaharan AfricanSudaneseSwedishSwissSyrianTaiwaneseThaiTlingit-HaidaTohono O'OdhamTonganTrinidadian and TobagonianTsimshianTurkishU.S. Virgin IslanderUgandanUkrainianUruguayanUteVenezuelanVietnameseWelshWest IndianYakamaYaquiYugoslavianYumanYup'ikZimbabwean
Immigration
NonimmigrantsImmigrantsAfghanistanAfricaAlbaniaArgentinaArmeniaAsiaAustraliaAustriaBahamasBangladeshBarbadosBelarusBelgiumBelizeBoliviaBosnia and HerzegovinaBrazilBulgariaBurma/MyanmarCabo VerdeCambodiaCameroonCanadaCaribbeanCentral AmericaChileChinaColombiaCongoCosta RicaCroatiaCubaCzechoslovakiaDenmarkDominicaDominican RepublicEastern AfricaEastern AsiaEastern EuropeEcuadorEgyptEl SalvadorEnglandEritreaEthiopiaEuropeFijiFranceGermanyGhanaGreeceGrenadaGuatemalaGuyanaHaitiHondurasHong KongHungaryIndiaIndonesiaIranIraqIrelandIsraelItalyJamaicaJapanJordanKazakhstanKenyaKoreaKuwaitLaosLatin AmericaLatviaLebanonLiberiaLithuaniaMalaysiaMexicoMicronesiaMiddle AfricaMoldovaMoroccoNepalNetherlandsNicaraguaNigeriaNorth AmericaNorth MacedoniaNorthern AfricaNorthern EuropeNorwayOceaniaPakistanPanamaPeruPhilippinesPolandPortugalRomaniaRussiaSaudi ArabiaScotlandSenegalSerbiaSierra LeoneSingaporeSomaliaSouth AfricaSouth AmericaSouth Central AsiaSouth Eastern AsiaSouthern EuropeSpainSri LankaSt. Vincent and the GrenadinesSudanSwedenSwitzerlandSyriaTaiwanThailandTrinidad and TobagoTurkeyUgandaUkraineUruguayUzbekistanVenezuelaVietnamWest IndiesWestern AfricaWestern AsiaWestern EuropeYemenZaireZimbabweAzores
Select to Compare
Race
Ancestry
AfghanAfricanAlaska NativeAlaskan AthabascanAlbanianAleutAlsatianAmericanApacheArabArapahoArgentineanArmenianAssyrian/Chaldean/SyriacAustralianAustrianBahamianBangladeshiBarbadianBasqueBelgianBelizeanBermudanBhutaneseBlackfeetBolivianBrazilianBritishBritish West IndianBulgarianBurmeseCajunCambodianCanadianCape VerdeanCarpatho RusynCelticCentral AmericanCentral American IndianCherokeeCheyenneChickasawChileanChineseChippewaChoctawColombianColvilleComancheCosta RicanCreeCreekCroatianCrowCubanCypriotCzechCzechoslovakianDanishDelawareDominicanDutchDutch West IndianEastern EuropeanEcuadorianEgyptianEnglishEstonianEthiopianEuropeanFijianFilipinoFinnishFrenchFrench American IndianFrench CanadianGermanGerman RussianGhanaianGreekGuamanian/ChamorroGuatemalanGuyaneseHaitianHmongHonduranHopiHoumaHungarianIcelanderIndian (Asian)IndonesianInupiatIranianIraqiIrishIroquoisIsraeliItalianJamaicanJapaneseJordanianKenyanKiowaKoreanLaotianLatvianLebaneseLiberianLithuanianLumbeeLuxembourgerMacedonianMalaysianMalteseMarshalleseMenomineeMexicanMexican American IndianMongolianMoroccanNative HawaiianNavajoNepaleseNew ZealanderNicaraguanNigerianNorthern EuropeanNorwegianOkinawanOsageOttawaPaiutePakistaniPalestinianPanamanianParaguayanPennsylvania GermanPeruvianPimaPolishPortuguesePotawatomiPuebloPuerto RicanPuget Sound SalishRomanianRussianSalvadoranSamoanScandinavianScotch-IrishScottishSeminoleSenegaleseSerbianShoshoneSierra LeoneanSiouxSlavicSlovakSloveneSomaliSouth AfricanSouth AmericanSouth American IndianSoviet UnionSpaniardSpanishSpanish AmericanSpanish American IndianSri LankanSubsaharan AfricanSudaneseSwedishSwissSyrianTaiwaneseThaiTlingit-HaidaTohono O'OdhamTonganTrinidadian and TobagonianTsimshianTurkishU.S. Virgin IslanderUgandanUkrainianUruguayanUteVenezuelanVietnameseWelshWest IndianYakamaYaquiYugoslavianYumanYup'ikZimbabwean
Immigration
NonimmigrantsImmigrantsAfghanistanAfricaAlbaniaArgentinaArmeniaAsiaAustraliaAustriaBahamasBangladeshBarbadosBelarusBelgiumBelizeBoliviaBosnia and HerzegovinaBrazilBulgariaBurma/MyanmarCabo VerdeCambodiaCameroonCanadaCaribbeanCentral AmericaChileChinaColombiaCongoCosta RicaCroatiaCubaCzechoslovakiaDenmarkDominicaDominican RepublicEastern AfricaEastern AsiaEastern EuropeEcuadorEgyptEl SalvadorEnglandEritreaEthiopiaEuropeFijiFranceGermanyGhanaGreeceGrenadaGuatemalaGuyanaHaitiHondurasHong KongHungaryIndiaIndonesiaIranIraqIrelandIsraelItalyJamaicaJapanJordanKazakhstanKenyaKoreaKuwaitLaosLatin AmericaLatviaLebanonLiberiaLithuaniaMalaysiaMexicoMicronesiaMiddle AfricaMoldovaMoroccoNepalNetherlandsNicaraguaNigeriaNorth AmericaNorth MacedoniaNorthern AfricaNorthern EuropeNorwayOceaniaPakistanPanamaPeruPhilippinesPolandPortugalRomaniaRussiaSaudi ArabiaScotlandSenegalSerbiaSierra LeoneSingaporeSomaliaSouth AfricaSouth AmericaSouth Central AsiaSouth Eastern AsiaSouthern EuropeSpainSri LankaSt. Vincent and the GrenadinesSudanSwedenSwitzerlandSyriaTaiwanThailandTrinidad and TobagoTurkeyUgandaUkraineUruguayUzbekistanVenezuelaVietnamWestern AfricaWestern AsiaWestern EuropeYemenZaireZimbabweAzores
Wage/Income Gap
Income
Poverty
Unemployment
Labor Participation
Family Structure
Vehicle Availability
Education Level
Disability

Immigrants from West Indies Wage/Income Gap
Exceptional

19.2%
WAGE/INCOME GAP
100.0/ 100
METRIC RATING
12th/ 347
METRIC RANK

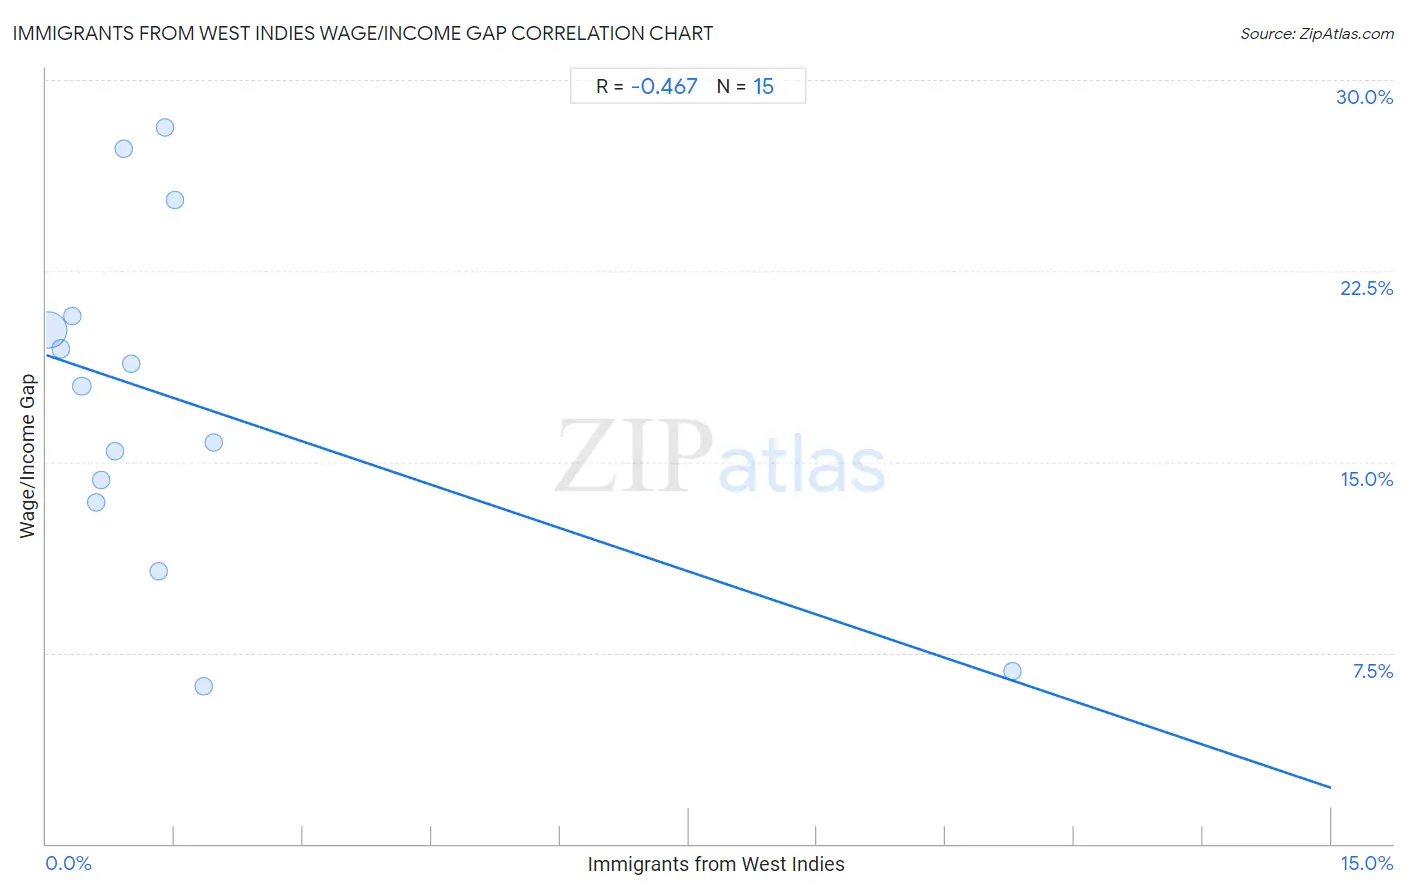
Immigrants from West Indies Wage/Income Gap Correlation Chart

The statistical analysis conducted on geographies consisting of 72,447,771 people shows a moderate negative correlation between the proportion of Immigrants from West Indies and wage/income gap percentage in the United States with a correlation coefficient (R) of -0.467 and weighted average of 19.2%. On average, for every 1% (one percent) increase in Immigrants from West Indies within a typical geography, there is a decrease of 1.1% in wage/income gap percentage.
Immigrants from West Indies Wage/Income Gap
It is essential to understand that the correlation between the percentage of Immigrants from West Indies and wage/income gap percentage does not imply a direct cause-and-effect relationship. It remains uncertain whether the presence of Immigrants from West Indies influences an upward or downward trend in the level of wage/income gap percentage within an area, or if Immigrants from West Indies simply ended up residing in those areas with higher or lower levels of wage/income gap percentage due to other factors.

Demographics Similar to Immigrants from West Indies by Wage/Income Gap

In terms of wage/income gap, the demographic groups most similar to Immigrants from West Indies are Immigrants from Haiti (19.2%, a difference of 0.11%), Trinidadian and Tobagonian (19.3%, a difference of 0.48%), Immigrants from Trinidad and Tobago (19.3%, a difference of 0.53%), Crow (19.1%, a difference of 0.90%), and Barbadian (19.0%, a difference of 1.4%).
DemographicsRating | RankWage/Income Gap
Guyanese
100.0
/100
|
#5
Exceptional
18.3%
Immigrants from Guyana
100.0
/100
|
#6
Exceptional
18.4%
Puerto Ricans
100.0
/100
|
#7
Exceptional
18.7%
Immigrants from Jamaica
100.0
/100
|
#8
Exceptional
18.8%
Barbadians
100.0
/100
|
#9
Exceptional
19.0%
Crow
100.0
/100
|
#10
Exceptional
19.1%
Immigrants from Haiti
100.0
/100
|
#11
Exceptional
19.2%
Immigrants from West Indies
100.0
/100
|
#12
Exceptional
19.2%
Trinidadians and Tobagonians
100.0
/100
|
#13
Exceptional
19.3%
Immigrants from Trinidad and Tobago
100.0
/100
|
#14
Exceptional
19.3%
West Indians
100.0
/100
|
#15
Exceptional
19.6%
Jamaicans
100.0
/100
|
#16
Exceptional
19.6%
Haitians
100.0
/100
|
#17
Exceptional
19.7%
Hopi
100.0
/100
|
#18
Exceptional
20.0%
Immigrants from Dominica
100.0
/100
|
#19
Exceptional
20.0%

Immigrants from West Indies Wage/Income Gap Correlation Summary

MeasurementImmigrants from West Indies DataWage/Income Gap Data
Minimum0.030%6.2%
Maximum11.3%28.2%
Range11.2%21.9%
Mean1.6%17.4%
Median0.91%18.0%
Interquartile 25% (IQ1)0.42%13.4%
Interquartile 75% (IQ3)1.5%20.7%
Interquartile Range (IQR)1.1%7.3%
Standard Deviation (Sample)2.7%6.6%
Standard Deviation (Population)2.6%6.4%

Correlation Details

Immigrants from West Indies PercentileSample SizeWage/Income Gap
[
0.0%
-
0.5%
]
0.030%
66,225,99120.2%
[
0.0%
-
0.5%
]
0.17%
3,576,56919.4%
[
0.0%
-
0.5%
]
0.30%
1,429,91620.7%
[
0.0%
-
0.5%
]
0.42%
550,80818.0%
[
0.5%
-
1.0%
]
0.58%
335,39313.4%
[
0.5%
-
1.0%
]
0.64%
117,59814.3%
[
0.5%
-
1.0%
]
0.80%
10,23915.4%
[
0.5%
-
1.0%
]
0.91%
37,03727.3%
[
0.5%
-
1.0%
]
0.99%
20,07818.9%
[
1.0%
-
1.5%
]
1.31%
104,50710.7%
[
1.0%
-
1.5%
]
1.38%
10,33528.2%
[
1.0%
-
1.5%
]
1.50%
16,80825.3%
[
1.5%
-
2.0%
]
1.84%
2,1726.2%
[
1.5%
-
2.0%
]
1.95%
9,98315.8%
[
11.0%
-
11.5%
]
11.28%
3376.8%