Immigrants from Turkey Wage/Income Gap
COMPARE
Immigrants from Turkey
Select to Compare
Wage/Income Gap
Immigrants from Turkey Wage/Income Gap
27.0%
WAGE/INCOME GAP
5.6/ 100
METRIC RATING
228th/ 347
METRIC RANK
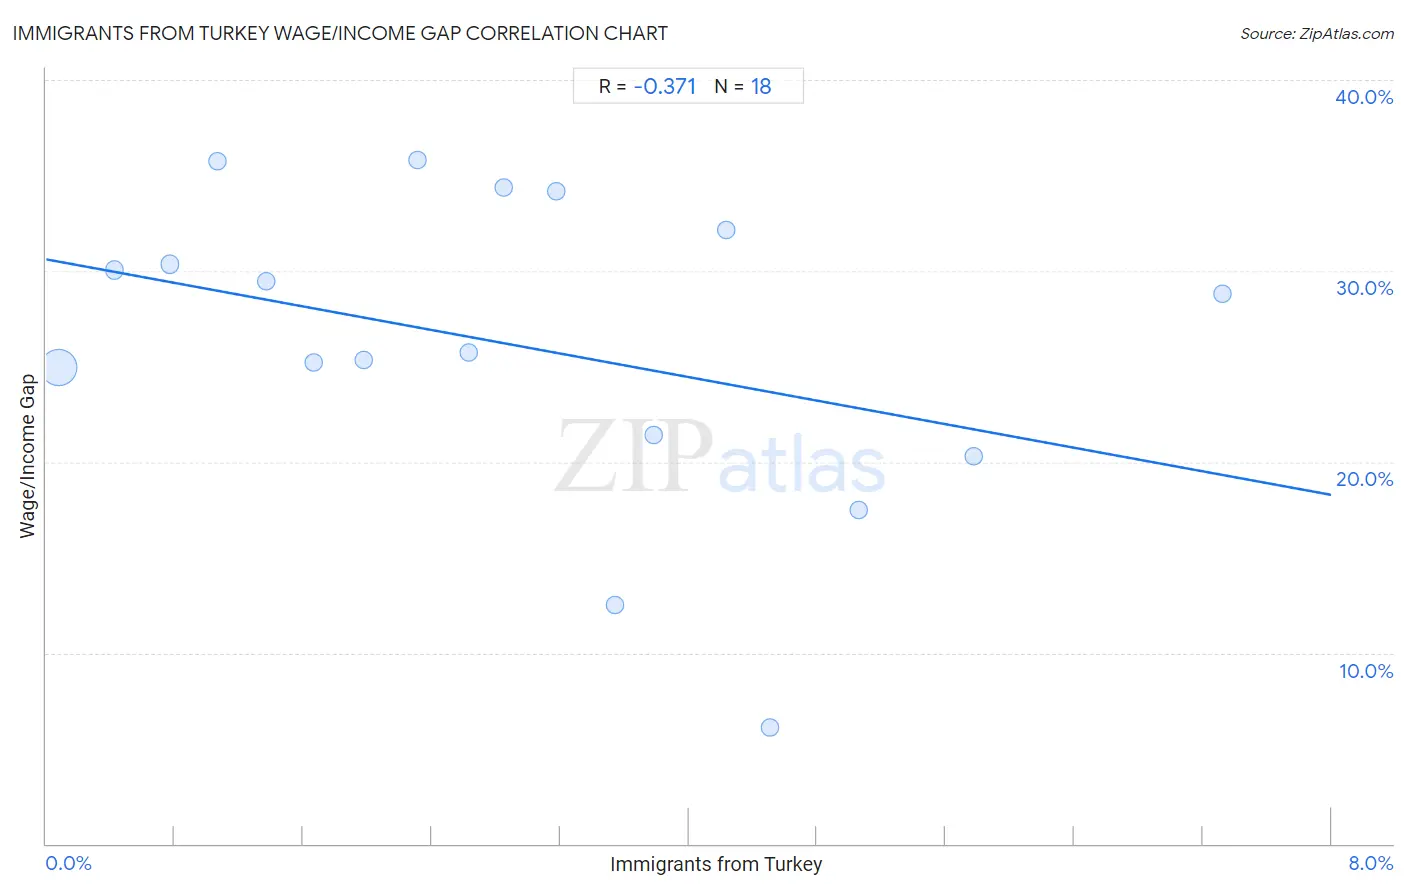
Immigrants from Turkey Wage/Income Gap Correlation Chart
The statistical analysis conducted on geographies consisting of 223,006,850 people shows a mild negative correlation between the proportion of Immigrants from Turkey and wage/income gap percentage in the United States with a correlation coefficient (R) of -0.371 and weighted average of 27.0%. On average, for every 1% (one percent) increase in Immigrants from Turkey within a typical geography, there is a decrease of 1.5% in wage/income gap percentage.
It is essential to understand that the correlation between the percentage of Immigrants from Turkey and wage/income gap percentage does not imply a direct cause-and-effect relationship. It remains uncertain whether the presence of Immigrants from Turkey influences an upward or downward trend in the level of wage/income gap percentage within an area, or if Immigrants from Turkey simply ended up residing in those areas with higher or lower levels of wage/income gap percentage due to other factors.
Demographics Similar to Immigrants from Turkey by Wage/Income Gap
In terms of wage/income gap, the demographic groups most similar to Immigrants from Turkey are Spaniard (27.0%, a difference of 0.0%), Immigrants from Asia (27.0%, a difference of 0.030%), Asian (26.9%, a difference of 0.080%), Ottawa (27.0%, a difference of 0.080%), and Bhutanese (27.0%, a difference of 0.11%).
| Demographics | Rating | Rank | Wage/Income Gap |
| Immigrants from Spain | 8.5 /100 | #221 | Tragic 26.8% |
| Bolivians | 8.3 /100 | #222 | Tragic 26.8% |
| Jordanians | 8.0 /100 | #223 | Tragic 26.8% |
| Immigrants from Argentina | 7.2 /100 | #224 | Tragic 26.8% |
| Immigrants from Ireland | 6.5 /100 | #225 | Tragic 26.9% |
| Asians | 5.9 /100 | #226 | Tragic 26.9% |
| Spaniards | 5.6 /100 | #227 | Tragic 27.0% |
| Immigrants from Turkey | 5.6 /100 | #228 | Tragic 27.0% |
| Immigrants from Asia | 5.5 /100 | #229 | Tragic 27.0% |
| Ottawa | 5.3 /100 | #230 | Tragic 27.0% |
| Bhutanese | 5.3 /100 | #231 | Tragic 27.0% |
| Argentineans | 5.2 /100 | #232 | Tragic 27.0% |
| Immigrants from Brazil | 5.0 /100 | #233 | Tragic 27.0% |
| Immigrants from Pakistan | 4.9 /100 | #234 | Tragic 27.0% |
| Immigrants from Hungary | 4.8 /100 | #235 | Tragic 27.0% |
Immigrants from Turkey Wage/Income Gap Correlation Summary
| Measurement | Immigrants from Turkey Data | Wage/Income Gap Data |
| Minimum | 0.075% | 6.1% |
| Maximum | 7.3% | 35.8% |
| Range | 7.2% | 29.7% |
| Mean | 2.9% | 26.1% |
| Median | 2.7% | 27.3% |
| Interquartile 25% (IQ1) | 1.4% | 21.4% |
| Interquartile 75% (IQ3) | 4.2% | 32.2% |
| Interquartile Range (IQR) | 2.9% | 10.8% |
| Standard Deviation (Sample) | 2.0% | 8.1% |
| Standard Deviation (Population) | 1.9% | 7.9% |
Correlation Details
| Immigrants from Turkey Percentile | Sample Size | Wage/Income Gap |
[ 0.0% - 0.5% ] 0.075% | 205,810,958 | 25.0% |
[ 0.0% - 0.5% ] 0.42% | 12,842,757 | 30.0% |
[ 0.5% - 1.0% ] 0.77% | 2,361,236 | 30.3% |
[ 1.0% - 1.5% ] 1.07% | 861,590 | 35.8% |
[ 1.0% - 1.5% ] 1.37% | 307,932 | 29.4% |
[ 1.5% - 2.0% ] 1.67% | 333,844 | 25.2% |
[ 1.5% - 2.0% ] 1.98% | 286,891 | 25.4% |
[ 2.0% - 2.5% ] 2.31% | 62,742 | 35.8% |
[ 2.5% - 3.0% ] 2.63% | 45,202 | 25.7% |
[ 2.5% - 3.0% ] 2.85% | 32,612 | 34.4% |
[ 3.0% - 3.5% ] 3.18% | 7,619 | 34.2% |
[ 3.5% - 4.0% ] 3.54% | 10,319 | 12.5% |
[ 3.5% - 4.0% ] 3.78% | 17,240 | 21.4% |
[ 4.0% - 4.5% ] 4.24% | 2,384 | 32.2% |
[ 4.5% - 5.0% ] 4.51% | 2,440 | 6.1% |
[ 5.0% - 5.5% ] 5.06% | 4,150 | 17.5% |
[ 5.5% - 6.0% ] 5.78% | 11,458 | 20.3% |
[ 7.0% - 7.5% ] 7.32% | 5,476 | 28.8% |