Immigrants from Trinidad and Tobago Married-couple Households
COMPARE
Immigrants from Trinidad and Tobago
Select to Compare
Married-couple Households
Immigrants from Trinidad and Tobago Married-couple Households
41.2%
MARRIED-COUPLE HOUSEHOLDS
0.0/ 100
METRIC RATING
309th/ 347
METRIC RANK
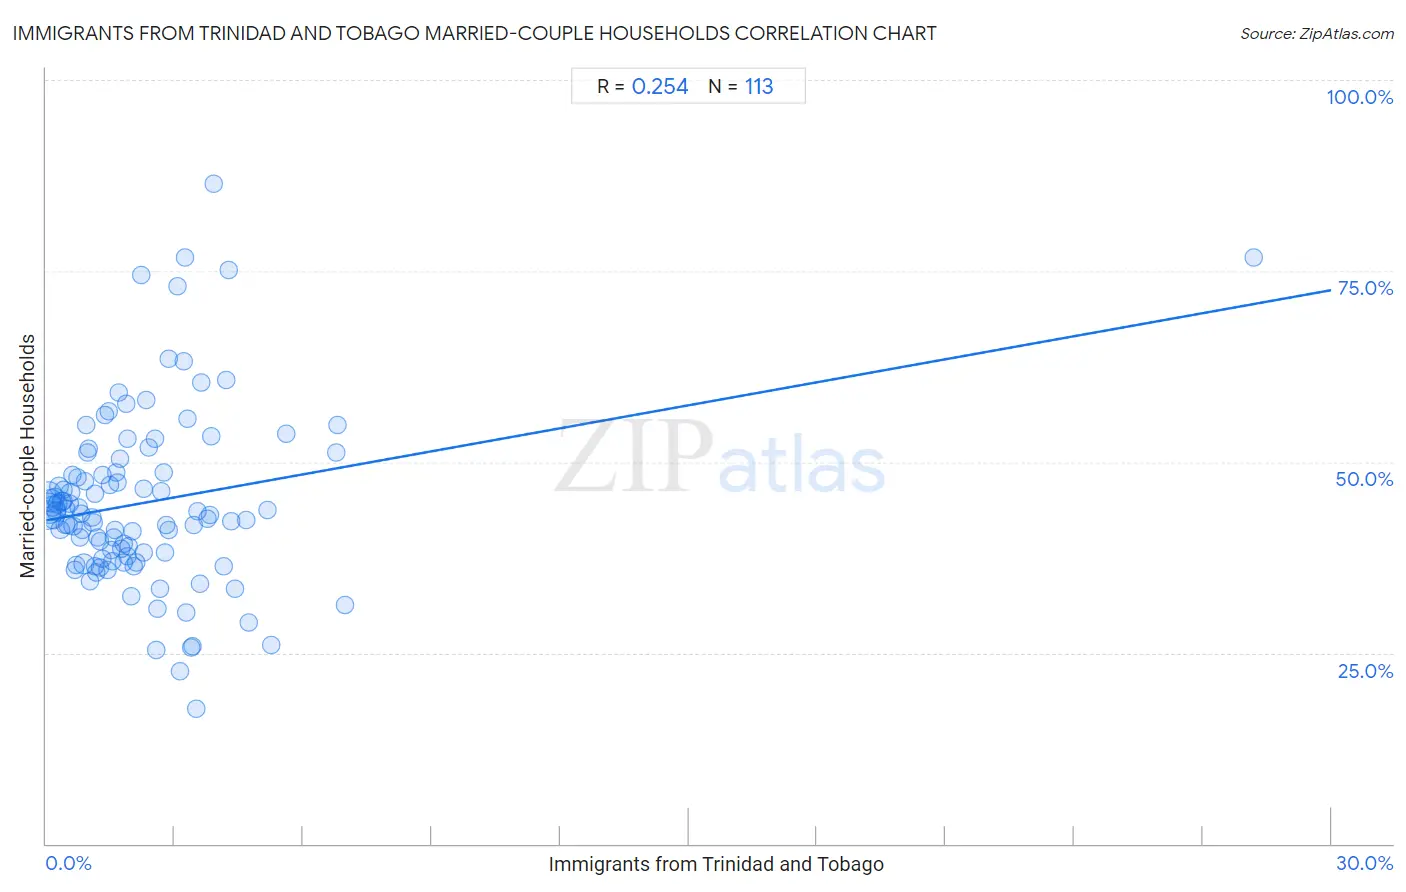
Immigrants from Trinidad and Tobago Married-couple Households Correlation Chart
The statistical analysis conducted on geographies consisting of 223,481,382 people shows a weak positive correlation between the proportion of Immigrants from Trinidad and Tobago and percentage of married-couple family households in the United States with a correlation coefficient (R) of 0.254 and weighted average of 41.2%. On average, for every 1% (one percent) increase in Immigrants from Trinidad and Tobago within a typical geography, there is an increase of 1.0% in percentage of married-couple family households.
It is essential to understand that the correlation between the percentage of Immigrants from Trinidad and Tobago and percentage of married-couple family households does not imply a direct cause-and-effect relationship. It remains uncertain whether the presence of Immigrants from Trinidad and Tobago influences an upward or downward trend in the level of percentage of married-couple family households within an area, or if Immigrants from Trinidad and Tobago simply ended up residing in those areas with higher or lower levels of percentage of married-couple family households due to other factors.
Demographics Similar to Immigrants from Trinidad and Tobago by Married-couple Households
In terms of married-couple households, the demographic groups most similar to Immigrants from Trinidad and Tobago are Haitian (41.2%, a difference of 0.070%), Crow (41.4%, a difference of 0.35%), Guyanese (41.4%, a difference of 0.36%), Immigrants from Western Africa (41.4%, a difference of 0.36%), and Colville (41.0%, a difference of 0.57%).
| Demographics | Rating | Rank | Married-couple Households |
| Immigrants from Honduras | 0.0 /100 | #302 | Tragic 41.6% |
| Sub-Saharan Africans | 0.0 /100 | #303 | Tragic 41.6% |
| Immigrants from Guyana | 0.0 /100 | #304 | Tragic 41.6% |
| Sioux | 0.0 /100 | #305 | Tragic 41.5% |
| Guyanese | 0.0 /100 | #306 | Tragic 41.4% |
| Immigrants from Western Africa | 0.0 /100 | #307 | Tragic 41.4% |
| Crow | 0.0 /100 | #308 | Tragic 41.4% |
| Immigrants from Trinidad and Tobago | 0.0 /100 | #309 | Tragic 41.2% |
| Haitians | 0.0 /100 | #310 | Tragic 41.2% |
| Colville | 0.0 /100 | #311 | Tragic 41.0% |
| Africans | 0.0 /100 | #312 | Tragic 40.9% |
| Immigrants from Haiti | 0.0 /100 | #313 | Tragic 40.9% |
| Jamaicans | 0.0 /100 | #314 | Tragic 40.9% |
| Trinidadians and Tobagonians | 0.0 /100 | #315 | Tragic 40.9% |
| Immigrants from Caribbean | 0.0 /100 | #316 | Tragic 40.8% |
Immigrants from Trinidad and Tobago Married-couple Households Correlation Summary
| Measurement | Immigrants from Trinidad and Tobago Data | Married-couple Households Data |
| Minimum | 0.016% | 17.7% |
| Maximum | 28.2% | 86.4% |
| Range | 28.2% | 68.7% |
| Mean | 2.3% | 44.7% |
| Median | 1.8% | 43.2% |
| Interquartile 25% (IQ1) | 0.87% | 37.5% |
| Interquartile 75% (IQ3) | 3.2% | 48.6% |
| Interquartile Range (IQR) | 2.4% | 11.2% |
| Standard Deviation (Sample) | 2.9% | 11.5% |
| Standard Deviation (Population) | 2.9% | 11.5% |
Correlation Details
| Immigrants from Trinidad and Tobago Percentile | Sample Size | Married-couple Households |
[ 0.0% - 0.5% ] 0.016% | 75,514,790 | 43.6% |
[ 0.0% - 0.5% ] 0.045% | 36,386,481 | 45.6% |
[ 0.0% - 0.5% ] 0.075% | 23,585,102 | 43.4% |
[ 0.0% - 0.5% ] 0.11% | 15,388,408 | 44.9% |
[ 0.0% - 0.5% ] 0.14% | 10,208,152 | 44.2% |
[ 0.0% - 0.5% ] 0.17% | 9,351,437 | 42.5% |
[ 0.0% - 0.5% ] 0.20% | 5,507,677 | 45.3% |
[ 0.0% - 0.5% ] 0.23% | 4,979,339 | 43.6% |
[ 0.0% - 0.5% ] 0.26% | 3,817,714 | 44.5% |
[ 0.0% - 0.5% ] 0.29% | 3,180,976 | 46.7% |
[ 0.0% - 0.5% ] 0.32% | 2,894,097 | 41.1% |
[ 0.0% - 0.5% ] 0.35% | 2,701,778 | 44.8% |
[ 0.0% - 0.5% ] 0.38% | 2,156,435 | 44.9% |
[ 0.0% - 0.5% ] 0.41% | 1,771,781 | 46.3% |
[ 0.0% - 0.5% ] 0.45% | 1,813,018 | 41.9% |
[ 0.0% - 0.5% ] 0.47% | 1,002,315 | 43.8% |
[ 0.5% - 1.0% ] 0.51% | 1,257,814 | 41.7% |
[ 0.5% - 1.0% ] 0.54% | 1,372,681 | 44.5% |
[ 0.5% - 1.0% ] 0.57% | 629,536 | 46.0% |
[ 0.5% - 1.0% ] 0.60% | 639,552 | 48.3% |
[ 0.5% - 1.0% ] 0.63% | 615,643 | 41.6% |
[ 0.5% - 1.0% ] 0.66% | 1,012,234 | 35.8% |
[ 0.5% - 1.0% ] 0.69% | 524,009 | 36.5% |
[ 0.5% - 1.0% ] 0.72% | 307,022 | 48.0% |
[ 0.5% - 1.0% ] 0.75% | 210,552 | 44.1% |
[ 0.5% - 1.0% ] 0.78% | 431,784 | 40.1% |
[ 0.5% - 1.0% ] 0.81% | 379,641 | 43.2% |
[ 0.5% - 1.0% ] 0.85% | 779,599 | 41.2% |
[ 0.5% - 1.0% ] 0.89% | 9,105,879 | 36.6% |
[ 0.5% - 1.0% ] 0.91% | 253,348 | 47.5% |
[ 0.5% - 1.0% ] 0.94% | 154,761 | 54.7% |
[ 0.5% - 1.0% ] 0.97% | 201,660 | 51.2% |
[ 0.5% - 1.0% ] 1.00% | 251,033 | 51.8% |
[ 1.0% - 1.5% ] 1.02% | 271,131 | 34.4% |
[ 1.0% - 1.5% ] 1.06% | 129,020 | 42.8% |
[ 1.0% - 1.5% ] 1.09% | 295,756 | 42.1% |
[ 1.0% - 1.5% ] 1.13% | 114,448 | 36.3% |
[ 1.0% - 1.5% ] 1.14% | 104,411 | 45.8% |
[ 1.0% - 1.5% ] 1.18% | 271,442 | 35.6% |
[ 1.0% - 1.5% ] 1.20% | 82,351 | 40.2% |
[ 1.0% - 1.5% ] 1.24% | 259,713 | 39.6% |
[ 1.0% - 1.5% ] 1.27% | 78,880 | 36.2% |
[ 1.0% - 1.5% ] 1.30% | 259,326 | 37.3% |
[ 1.0% - 1.5% ] 1.32% | 22,063 | 48.3% |
[ 1.0% - 1.5% ] 1.36% | 51,452 | 56.1% |
[ 1.0% - 1.5% ] 1.42% | 110,190 | 35.8% |
[ 1.0% - 1.5% ] 1.45% | 75,816 | 56.6% |
[ 1.0% - 1.5% ] 1.49% | 159,013 | 46.9% |
[ 1.5% - 2.0% ] 1.52% | 28,841 | 38.4% |
[ 1.5% - 2.0% ] 1.55% | 131,172 | 37.1% |
[ 1.5% - 2.0% ] 1.57% | 36,359 | 40.0% |
[ 1.5% - 2.0% ] 1.60% | 100,450 | 41.1% |
[ 1.5% - 2.0% ] 1.63% | 35,744 | 48.6% |
[ 1.5% - 2.0% ] 1.67% | 56,182 | 47.3% |
[ 1.5% - 2.0% ] 1.70% | 47,515 | 59.1% |
[ 1.5% - 2.0% ] 1.73% | 40,484 | 50.3% |
[ 1.5% - 2.0% ] 1.76% | 145,080 | 38.7% |
[ 1.5% - 2.0% ] 1.80% | 20,336 | 36.8% |
[ 1.5% - 2.0% ] 1.82% | 117,288 | 39.3% |
[ 1.5% - 2.0% ] 1.86% | 43,396 | 57.6% |
[ 1.5% - 2.0% ] 1.88% | 11,837 | 53.1% |
[ 1.5% - 2.0% ] 1.90% | 29,348 | 37.6% |
[ 1.5% - 2.0% ] 1.94% | 55,114 | 38.9% |
[ 1.5% - 2.0% ] 1.98% | 55,336 | 32.4% |
[ 2.0% - 2.5% ] 2.01% | 40,738 | 41.0% |
[ 2.0% - 2.5% ] 2.05% | 52,000 | 36.4% |
[ 2.0% - 2.5% ] 2.09% | 47,691 | 36.8% |
[ 2.0% - 2.5% ] 2.22% | 4,910 | 74.5% |
[ 2.0% - 2.5% ] 2.27% | 7,104 | 38.2% |
[ 2.0% - 2.5% ] 2.27% | 18,470 | 46.4% |
[ 2.0% - 2.5% ] 2.34% | 898 | 58.0% |
[ 2.0% - 2.5% ] 2.40% | 65,645 | 51.9% |
[ 2.5% - 3.0% ] 2.54% | 2,720 | 53.0% |
[ 2.5% - 3.0% ] 2.57% | 96,801 | 25.4% |
[ 2.5% - 3.0% ] 2.59% | 189,692 | 30.8% |
[ 2.5% - 3.0% ] 2.66% | 10,526 | 33.4% |
[ 2.5% - 3.0% ] 2.68% | 5,740 | 46.2% |
[ 2.5% - 3.0% ] 2.74% | 108,992 | 48.7% |
[ 2.5% - 3.0% ] 2.77% | 79,458 | 38.1% |
[ 2.5% - 3.0% ] 2.81% | 32,296 | 41.7% |
[ 2.5% - 3.0% ] 2.85% | 6,529 | 63.5% |
[ 2.5% - 3.0% ] 2.86% | 67,242 | 41.1% |
[ 3.0% - 3.5% ] 3.05% | 17,400 | 73.0% |
[ 3.0% - 3.5% ] 3.12% | 83,125 | 22.7% |
[ 3.0% - 3.5% ] 3.20% | 9,011 | 63.2% |
[ 3.0% - 3.5% ] 3.24% | 1,726 | 76.8% |
[ 3.0% - 3.5% ] 3.26% | 24,994 | 30.4% |
[ 3.0% - 3.5% ] 3.31% | 1,510 | 55.7% |
[ 3.0% - 3.5% ] 3.39% | 30,946 | 25.7% |
[ 3.0% - 3.5% ] 3.40% | 69,131 | 25.8% |
[ 3.0% - 3.5% ] 3.45% | 55,605 | 41.7% |
[ 3.5% - 4.0% ] 3.51% | 84,006 | 17.7% |
[ 3.5% - 4.0% ] 3.53% | 27,845 | 43.5% |
[ 3.5% - 4.0% ] 3.58% | 100,082 | 34.1% |
[ 3.5% - 4.0% ] 3.61% | 3,270 | 60.3% |
[ 3.5% - 4.0% ] 3.76% | 585 | 42.6% |
[ 3.5% - 4.0% ] 3.83% | 58,396 | 43.0% |
[ 3.5% - 4.0% ] 3.84% | 5,938 | 53.4% |
[ 3.5% - 4.0% ] 3.92% | 51 | 86.4% |
[ 4.0% - 4.5% ] 4.14% | 8,260 | 36.3% |
[ 4.0% - 4.5% ] 4.20% | 8,779 | 60.7% |
[ 4.0% - 4.5% ] 4.25% | 541 | 75.1% |
[ 4.0% - 4.5% ] 4.32% | 21,349 | 42.3% |
[ 4.0% - 4.5% ] 4.40% | 182 | 33.3% |
[ 4.5% - 5.0% ] 4.66% | 63,426 | 42.4% |
[ 4.5% - 5.0% ] 4.72% | 101,648 | 29.0% |
[ 5.0% - 5.5% ] 5.16% | 2,657 | 43.7% |
[ 5.0% - 5.5% ] 5.24% | 58,476 | 26.0% |
[ 5.5% - 6.0% ] 5.59% | 1,055 | 53.8% |
[ 6.5% - 7.0% ] 6.77% | 251 | 51.2% |
[ 6.5% - 7.0% ] 6.80% | 99,249 | 54.8% |
[ 6.5% - 7.0% ] 6.98% | 78,506 | 31.3% |
[ 28.0% - 28.5% ] 28.19% | 188 | 76.7% |