Immigrants from Trinidad and Tobago Married-Couple Family Poverty
COMPARE
Immigrants from Trinidad and Tobago
Select to Compare
Married-Couple Family Poverty
Immigrants from Trinidad and Tobago Married-Couple Family Poverty
6.4%
POVERTY | MARRIED-COUPLE FAMILIES
0.1/ 100
METRIC RATING
278th/ 347
METRIC RANK
Immigrants from Trinidad and Tobago Married-Couple Family Poverty Correlation Chart
The statistical analysis conducted on geographies consisting of 222,433,461 people shows a strong positive correlation between the proportion of Immigrants from Trinidad and Tobago and poverty level among married-couple families in the United States with a correlation coefficient (R) of 0.783 and weighted average of 6.4%. On average, for every 1% (one percent) increase in Immigrants from Trinidad and Tobago within a typical geography, there is an increase of 2.2% in poverty level among married-couple families.
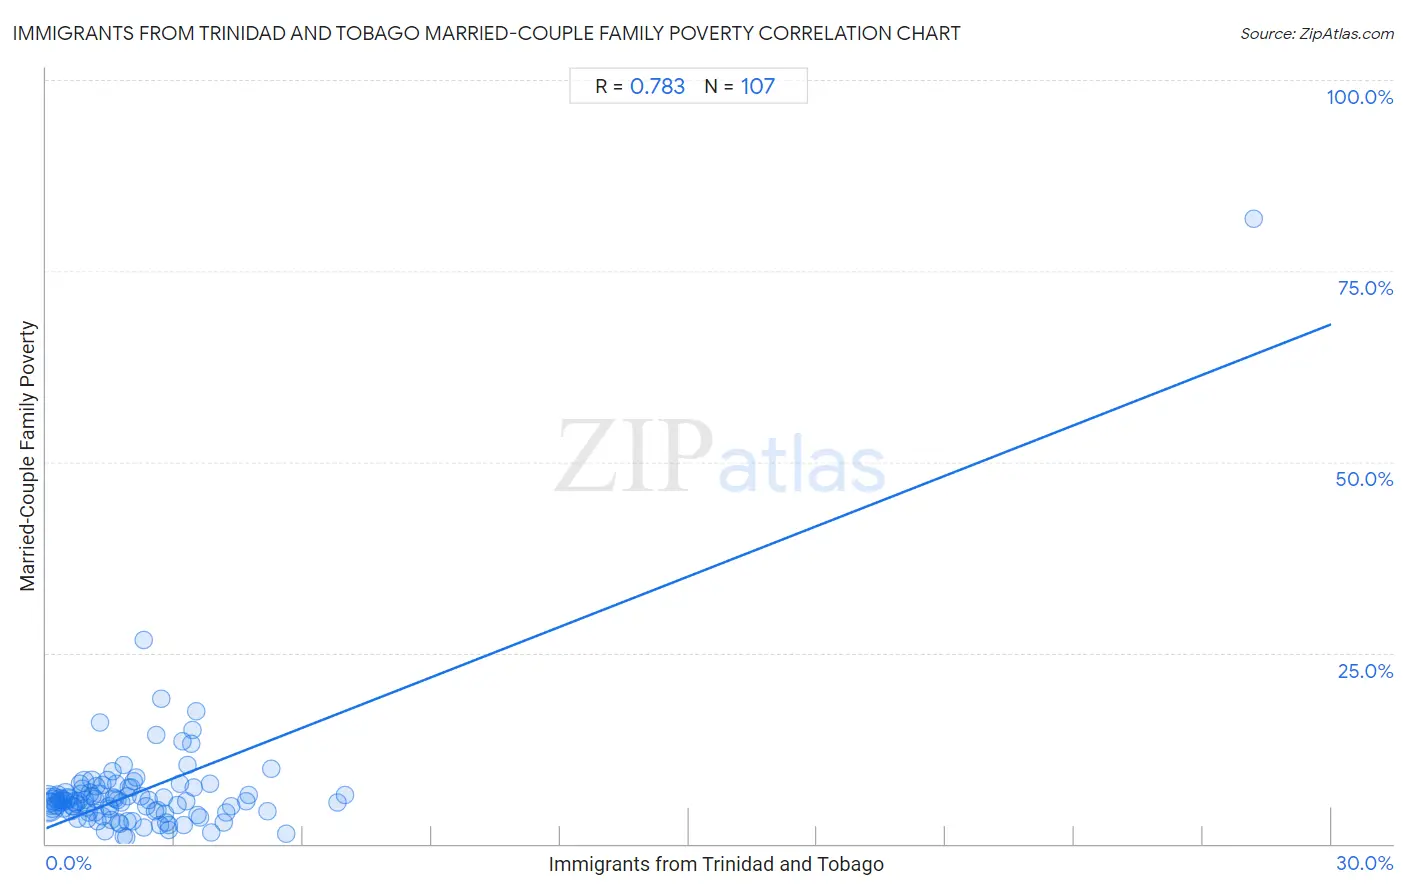
It is essential to understand that the correlation between the percentage of Immigrants from Trinidad and Tobago and poverty level among married-couple families does not imply a direct cause-and-effect relationship. It remains uncertain whether the presence of Immigrants from Trinidad and Tobago influences an upward or downward trend in the level of poverty level among married-couple families within an area, or if Immigrants from Trinidad and Tobago simply ended up residing in those areas with higher or lower levels of poverty level among married-couple families due to other factors.
Demographics Similar to Immigrants from Trinidad and Tobago by Married-Couple Family Poverty
In terms of married-couple family poverty, the demographic groups most similar to Immigrants from Trinidad and Tobago are Houma (6.4%, a difference of 0.25%), West Indian (6.4%, a difference of 0.29%), Indonesian (6.3%, a difference of 0.48%), Yaqui (6.3%, a difference of 0.62%), and Mexican American Indian (6.4%, a difference of 0.80%).
| Demographics | Rating | Rank | Married-Couple Family Poverty |
| Immigrants from Bahamas | 0.1 /100 | #271 | Tragic 6.2% |
| Trinidadians and Tobagonians | 0.1 /100 | #272 | Tragic 6.2% |
| Colville | 0.1 /100 | #273 | Tragic 6.3% |
| Barbadians | 0.1 /100 | #274 | Tragic 6.3% |
| Choctaw | 0.1 /100 | #275 | Tragic 6.3% |
| Yaqui | 0.1 /100 | #276 | Tragic 6.3% |
| Indonesians | 0.1 /100 | #277 | Tragic 6.3% |
| Immigrants from Trinidad and Tobago | 0.1 /100 | #278 | Tragic 6.4% |
| Houma | 0.0 /100 | #279 | Tragic 6.4% |
| West Indians | 0.0 /100 | #280 | Tragic 6.4% |
| Mexican American Indians | 0.0 /100 | #281 | Tragic 6.4% |
| Seminole | 0.0 /100 | #282 | Tragic 6.4% |
| Ute | 0.0 /100 | #283 | Tragic 6.4% |
| Dutch West Indians | 0.0 /100 | #284 | Tragic 6.4% |
| Blacks/African Americans | 0.0 /100 | #285 | Tragic 6.5% |
Immigrants from Trinidad and Tobago Married-Couple Family Poverty Correlation Summary
| Measurement | Immigrants from Trinidad and Tobago Data | Married-Couple Family Poverty Data |
| Minimum | 0.016% | 0.88% |
| Maximum | 28.2% | 81.8% |
| Range | 28.2% | 80.9% |
| Mean | 2.2% | 6.9% |
| Median | 1.7% | 5.6% |
| Interquartile 25% (IQ1) | 0.81% | 4.1% |
| Interquartile 75% (IQ3) | 2.8% | 7.4% |
| Interquartile Range (IQR) | 2.0% | 3.2% |
| Standard Deviation (Sample) | 2.9% | 8.2% |
| Standard Deviation (Population) | 2.9% | 8.2% |
Correlation Details
| Immigrants from Trinidad and Tobago Percentile | Sample Size | Married-Couple Family Poverty |
[ 0.0% - 0.5% ] 0.016% | 75,430,771 | 5.3% |
[ 0.0% - 0.5% ] 0.045% | 36,349,190 | 4.9% |
[ 0.0% - 0.5% ] 0.075% | 23,485,351 | 5.7% |
[ 0.0% - 0.5% ] 0.11% | 15,274,583 | 5.2% |
[ 0.0% - 0.5% ] 0.14% | 10,115,481 | 4.8% |
[ 0.0% - 0.5% ] 0.17% | 9,309,886 | 5.7% |
[ 0.0% - 0.5% ] 0.20% | 5,493,054 | 6.0% |
[ 0.0% - 0.5% ] 0.23% | 4,908,723 | 5.0% |
[ 0.0% - 0.5% ] 0.26% | 3,776,091 | 6.4% |
[ 0.0% - 0.5% ] 0.29% | 3,165,610 | 5.4% |
[ 0.0% - 0.5% ] 0.32% | 2,874,313 | 5.9% |
[ 0.0% - 0.5% ] 0.35% | 2,688,842 | 5.5% |
[ 0.0% - 0.5% ] 0.38% | 2,145,229 | 5.8% |
[ 0.0% - 0.5% ] 0.41% | 1,752,125 | 4.6% |
[ 0.0% - 0.5% ] 0.45% | 1,787,086 | 6.6% |
[ 0.0% - 0.5% ] 0.47% | 977,933 | 5.5% |
[ 0.5% - 1.0% ] 0.51% | 1,237,251 | 6.1% |
[ 0.5% - 1.0% ] 0.54% | 1,364,319 | 5.9% |
[ 0.5% - 1.0% ] 0.57% | 616,163 | 4.3% |
[ 0.5% - 1.0% ] 0.60% | 633,473 | 5.0% |
[ 0.5% - 1.0% ] 0.63% | 595,194 | 4.9% |
[ 0.5% - 1.0% ] 0.66% | 983,525 | 5.5% |
[ 0.5% - 1.0% ] 0.69% | 523,437 | 5.2% |
[ 0.5% - 1.0% ] 0.72% | 301,282 | 3.3% |
[ 0.5% - 1.0% ] 0.75% | 196,199 | 5.6% |
[ 0.5% - 1.0% ] 0.78% | 418,711 | 7.9% |
[ 0.5% - 1.0% ] 0.81% | 377,305 | 6.6% |
[ 0.5% - 1.0% ] 0.85% | 779,599 | 7.2% |
[ 0.5% - 1.0% ] 0.89% | 9,104,731 | 8.1% |
[ 0.5% - 1.0% ] 0.91% | 242,078 | 5.7% |
[ 0.5% - 1.0% ] 0.94% | 151,474 | 4.7% |
[ 0.5% - 1.0% ] 0.97% | 195,083 | 3.2% |
[ 0.5% - 1.0% ] 1.00% | 242,825 | 4.1% |
[ 1.0% - 1.5% ] 1.02% | 269,071 | 6.6% |
[ 1.0% - 1.5% ] 1.06% | 127,985 | 8.3% |
[ 1.0% - 1.5% ] 1.09% | 267,422 | 6.2% |
[ 1.0% - 1.5% ] 1.13% | 111,682 | 5.9% |
[ 1.0% - 1.5% ] 1.14% | 97,605 | 4.0% |
[ 1.0% - 1.5% ] 1.18% | 265,291 | 7.5% |
[ 1.0% - 1.5% ] 1.20% | 69,818 | 3.0% |
[ 1.0% - 1.5% ] 1.24% | 246,133 | 6.5% |
[ 1.0% - 1.5% ] 1.27% | 78,880 | 15.9% |
[ 1.0% - 1.5% ] 1.30% | 259,326 | 7.7% |
[ 1.0% - 1.5% ] 1.32% | 18,995 | 3.6% |
[ 1.0% - 1.5% ] 1.36% | 44,733 | 1.7% |
[ 1.0% - 1.5% ] 1.42% | 110,190 | 8.4% |
[ 1.0% - 1.5% ] 1.45% | 67,765 | 4.9% |
[ 1.0% - 1.5% ] 1.49% | 152,789 | 4.6% |
[ 1.5% - 2.0% ] 1.52% | 28,841 | 3.1% |
[ 1.5% - 2.0% ] 1.55% | 129,883 | 9.5% |
[ 1.5% - 2.0% ] 1.57% | 36,359 | 6.0% |
[ 1.5% - 2.0% ] 1.60% | 99,459 | 5.8% |
[ 1.5% - 2.0% ] 1.63% | 31,200 | 7.8% |
[ 1.5% - 2.0% ] 1.67% | 56,182 | 5.7% |
[ 1.5% - 2.0% ] 1.70% | 47,515 | 2.8% |
[ 1.5% - 2.0% ] 1.73% | 40,484 | 2.6% |
[ 1.5% - 2.0% ] 1.76% | 145,080 | 5.4% |
[ 1.5% - 2.0% ] 1.80% | 20,336 | 0.96% |
[ 1.5% - 2.0% ] 1.82% | 108,180 | 10.4% |
[ 1.5% - 2.0% ] 1.86% | 43,396 | 0.88% |
[ 1.5% - 2.0% ] 1.89% | 10,821 | 3.0% |
[ 1.5% - 2.0% ] 1.90% | 28,101 | 6.2% |
[ 1.5% - 2.0% ] 1.94% | 52,792 | 7.4% |
[ 1.5% - 2.0% ] 1.98% | 55,336 | 7.4% |
[ 2.0% - 2.5% ] 2.01% | 40,738 | 3.0% |
[ 2.0% - 2.5% ] 2.05% | 52,000 | 8.2% |
[ 2.0% - 2.5% ] 2.09% | 44,635 | 8.7% |
[ 2.0% - 2.5% ] 2.22% | 4,910 | 6.3% |
[ 2.0% - 2.5% ] 2.27% | 7,104 | 2.2% |
[ 2.0% - 2.5% ] 2.27% | 18,470 | 26.7% |
[ 2.0% - 2.5% ] 2.34% | 898 | 4.9% |
[ 2.0% - 2.5% ] 2.40% | 61,073 | 5.7% |
[ 2.5% - 3.0% ] 2.54% | 2,720 | 4.3% |
[ 2.5% - 3.0% ] 2.57% | 96,801 | 14.2% |
[ 2.5% - 3.0% ] 2.59% | 189,692 | 4.4% |
[ 2.5% - 3.0% ] 2.66% | 10,526 | 2.5% |
[ 2.5% - 3.0% ] 2.68% | 1,304 | 18.9% |
[ 2.5% - 3.0% ] 2.73% | 89,976 | 6.0% |
[ 2.5% - 3.0% ] 2.77% | 79,458 | 4.0% |
[ 2.5% - 3.0% ] 2.81% | 32,296 | 2.8% |
[ 2.5% - 3.0% ] 2.85% | 6,529 | 2.4% |
[ 2.5% - 3.0% ] 2.86% | 66,161 | 1.8% |
[ 3.0% - 3.5% ] 3.05% | 17,400 | 5.1% |
[ 3.0% - 3.5% ] 3.12% | 83,125 | 7.9% |
[ 3.0% - 3.5% ] 3.17% | 630 | 13.5% |
[ 3.0% - 3.5% ] 3.20% | 9,011 | 2.5% |
[ 3.0% - 3.5% ] 3.26% | 24,994 | 5.5% |
[ 3.0% - 3.5% ] 3.31% | 1,510 | 10.4% |
[ 3.0% - 3.5% ] 3.39% | 29,820 | 13.1% |
[ 3.0% - 3.5% ] 3.40% | 69,131 | 14.9% |
[ 3.0% - 3.5% ] 3.45% | 55,143 | 7.4% |
[ 3.5% - 4.0% ] 3.51% | 84,006 | 17.4% |
[ 3.5% - 4.0% ] 3.53% | 27,845 | 3.7% |
[ 3.5% - 4.0% ] 3.58% | 100,082 | 3.4% |
[ 3.5% - 4.0% ] 3.83% | 58,396 | 7.8% |
[ 3.5% - 4.0% ] 3.84% | 5,938 | 1.5% |
[ 4.0% - 4.5% ] 4.14% | 8,260 | 2.8% |
[ 4.0% - 4.5% ] 4.20% | 8,779 | 4.1% |
[ 4.0% - 4.5% ] 4.32% | 21,349 | 4.9% |
[ 4.5% - 5.0% ] 4.66% | 63,426 | 5.6% |
[ 4.5% - 5.0% ] 4.72% | 101,053 | 6.4% |
[ 5.0% - 5.5% ] 5.15% | 2,231 | 4.2% |
[ 5.0% - 5.5% ] 5.24% | 58,476 | 9.9% |
[ 5.5% - 6.0% ] 5.59% | 1,055 | 1.2% |
[ 6.5% - 7.0% ] 6.80% | 99,249 | 5.3% |
[ 6.5% - 7.0% ] 6.98% | 78,506 | 6.4% |
[ 28.0% - 28.5% ] 28.19% | 188 | 81.8% |