Immigrants from Taiwan 2 or more Vehicles in Household
COMPARE
Immigrants from Taiwan
Select to Compare
2 or more Vehicles in Household
Immigrants from Taiwan 2 or more Vehicles in Household
59.7%
2+ VEHICLES AVAILABLE
100.0/ 100
METRIC RATING
45th/ 347
METRIC RANK
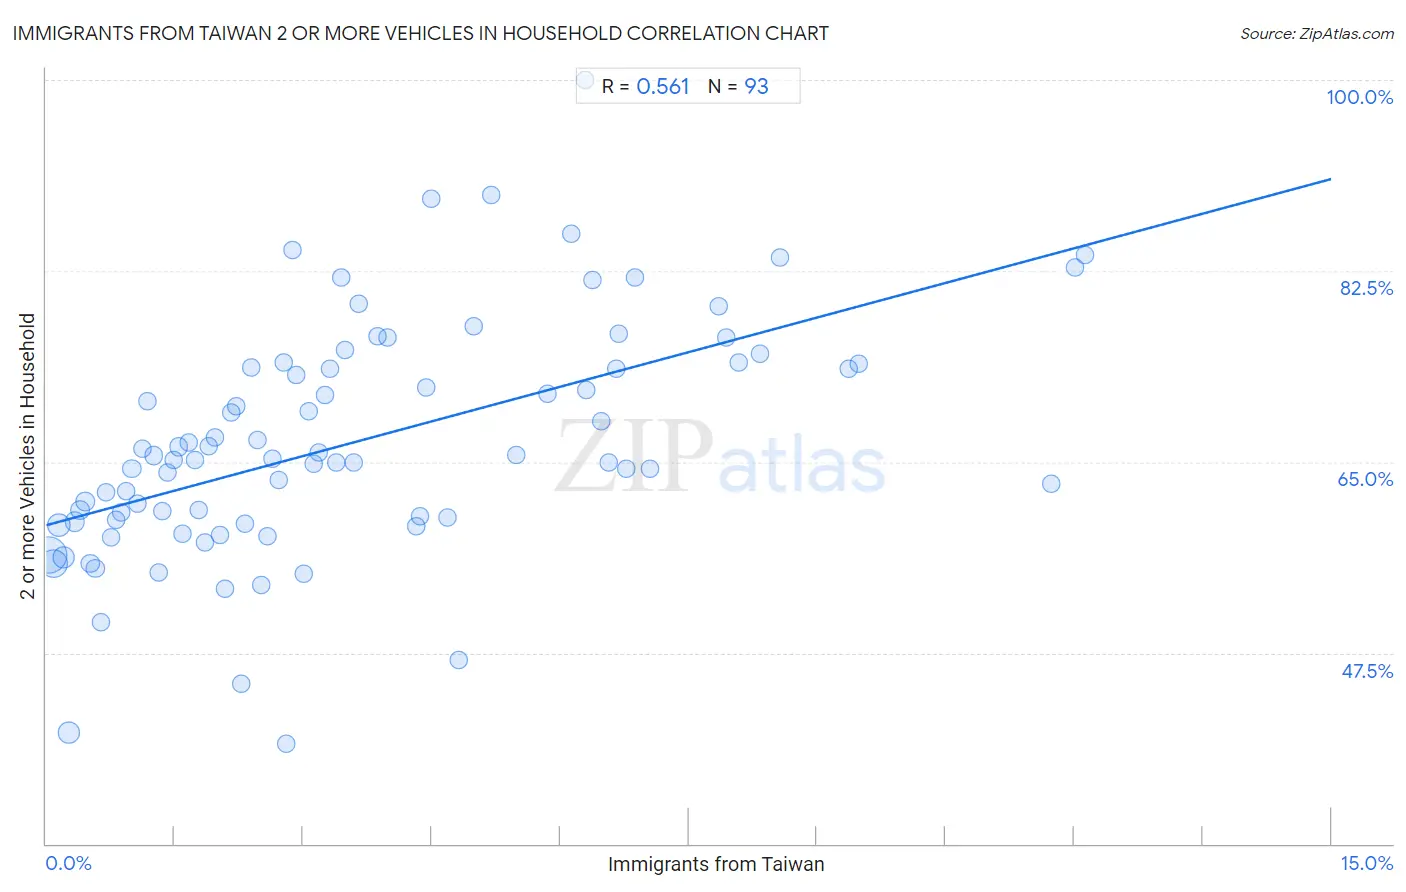
Immigrants from Taiwan 2 or more Vehicles in Household Correlation Chart
The statistical analysis conducted on geographies consisting of 298,141,678 people shows a substantial positive correlation between the proportion of Immigrants from Taiwan and percentage of households with 2 or more vehicles available in the United States with a correlation coefficient (R) of 0.561 and weighted average of 59.7%. On average, for every 1% (one percent) increase in Immigrants from Taiwan within a typical geography, there is an increase of 2.1% in percentage of households with 2 or more vehicles available.
It is essential to understand that the correlation between the percentage of Immigrants from Taiwan and percentage of households with 2 or more vehicles available does not imply a direct cause-and-effect relationship. It remains uncertain whether the presence of Immigrants from Taiwan influences an upward or downward trend in the level of percentage of households with 2 or more vehicles available within an area, or if Immigrants from Taiwan simply ended up residing in those areas with higher or lower levels of percentage of households with 2 or more vehicles available due to other factors.
Demographics Similar to Immigrants from Taiwan by 2 or more Vehicles in Household
In terms of 2 or more vehicles in household, the demographic groups most similar to Immigrants from Taiwan are French (59.8%, a difference of 0.040%), Czechoslovakian (59.8%, a difference of 0.10%), Malaysian (59.8%, a difference of 0.18%), Northern European (59.9%, a difference of 0.19%), and Cherokee (59.9%, a difference of 0.21%).
| Demographics | Rating | Rank | 2 or more Vehicles in Household |
| Americans | 100.0 /100 | #38 | Exceptional 60.0% |
| British | 100.0 /100 | #39 | Exceptional 60.0% |
| Cherokee | 100.0 /100 | #40 | Exceptional 59.9% |
| Northern Europeans | 100.0 /100 | #41 | Exceptional 59.9% |
| Malaysians | 100.0 /100 | #42 | Exceptional 59.8% |
| Czechoslovakians | 100.0 /100 | #43 | Exceptional 59.8% |
| French | 100.0 /100 | #44 | Exceptional 59.8% |
| Immigrants from Taiwan | 100.0 /100 | #45 | Exceptional 59.7% |
| Immigrants from South Eastern Asia | 100.0 /100 | #46 | Exceptional 59.6% |
| Yaqui | 99.9 /100 | #47 | Exceptional 59.3% |
| Immigrants from India | 99.9 /100 | #48 | Exceptional 59.3% |
| Belgians | 99.9 /100 | #49 | Exceptional 59.3% |
| Choctaw | 99.9 /100 | #50 | Exceptional 59.3% |
| Spaniards | 99.9 /100 | #51 | Exceptional 59.2% |
| Immigrants from Laos | 99.9 /100 | #52 | Exceptional 59.2% |
Immigrants from Taiwan 2 or more Vehicles in Household Correlation Summary
| Measurement | Immigrants from Taiwan Data | 2 or more Vehicles in Household Data |
| Minimum | 0.032% | 39.2% |
| Maximum | 12.1% | 100.0% |
| Range | 12.1% | 60.8% |
| Mean | 3.6% | 66.8% |
| Median | 2.8% | 65.3% |
| Interquartile 25% (IQ1) | 1.4% | 59.6% |
| Interquartile 75% (IQ3) | 5.3% | 73.8% |
| Interquartile Range (IQR) | 3.9% | 14.2% |
| Standard Deviation (Sample) | 2.9% | 10.8% |
| Standard Deviation (Population) | 2.8% | 10.7% |
Correlation Details
| Immigrants from Taiwan Percentile | Sample Size | 2 or more Vehicles in Household |
[ 0.0% - 0.5% ] 0.032% | 111,300,016 | 56.5% |
[ 0.0% - 0.5% ] 0.084% | 60,919,033 | 55.7% |
[ 0.0% - 0.5% ] 0.15% | 28,375,323 | 59.2% |
[ 0.0% - 0.5% ] 0.21% | 23,678,903 | 56.2% |
[ 0.0% - 0.5% ] 0.26% | 20,870,636 | 40.2% |
[ 0.0% - 0.5% ] 0.33% | 9,710,266 | 59.5% |
[ 0.0% - 0.5% ] 0.39% | 6,480,557 | 60.6% |
[ 0.0% - 0.5% ] 0.46% | 4,473,267 | 61.4% |
[ 0.5% - 1.0% ] 0.51% | 3,790,918 | 55.7% |
[ 0.5% - 1.0% ] 0.58% | 4,018,548 | 55.2% |
[ 0.5% - 1.0% ] 0.64% | 3,509,562 | 50.3% |
[ 0.5% - 1.0% ] 0.70% | 2,497,084 | 62.2% |
[ 0.5% - 1.0% ] 0.76% | 1,672,810 | 58.1% |
[ 0.5% - 1.0% ] 0.82% | 1,391,931 | 59.7% |
[ 0.5% - 1.0% ] 0.88% | 1,195,371 | 60.4% |
[ 0.5% - 1.0% ] 0.94% | 1,143,784 | 62.3% |
[ 0.5% - 1.0% ] 1.00% | 908,107 | 64.4% |
[ 1.0% - 1.5% ] 1.06% | 1,031,552 | 61.2% |
[ 1.0% - 1.5% ] 1.12% | 769,940 | 66.2% |
[ 1.0% - 1.5% ] 1.18% | 767,757 | 70.6% |
[ 1.0% - 1.5% ] 1.25% | 585,778 | 65.6% |
[ 1.0% - 1.5% ] 1.31% | 161,280 | 54.8% |
[ 1.0% - 1.5% ] 1.35% | 1,684,286 | 60.5% |
[ 1.0% - 1.5% ] 1.42% | 232,124 | 64.0% |
[ 1.0% - 1.5% ] 1.48% | 497,074 | 65.1% |
[ 1.5% - 2.0% ] 1.54% | 657,491 | 66.4% |
[ 1.5% - 2.0% ] 1.59% | 106,109 | 58.4% |
[ 1.5% - 2.0% ] 1.67% | 259,288 | 66.8% |
[ 1.5% - 2.0% ] 1.74% | 104,480 | 65.2% |
[ 1.5% - 2.0% ] 1.78% | 56,135 | 60.6% |
[ 1.5% - 2.0% ] 1.86% | 411,301 | 57.6% |
[ 1.5% - 2.0% ] 1.90% | 268,133 | 66.4% |
[ 1.5% - 2.0% ] 1.97% | 612,178 | 67.3% |
[ 2.0% - 2.5% ] 2.02% | 99,729 | 58.3% |
[ 2.0% - 2.5% ] 2.09% | 197,657 | 53.3% |
[ 2.0% - 2.5% ] 2.15% | 141,595 | 69.5% |
[ 2.0% - 2.5% ] 2.22% | 68,508 | 70.0% |
[ 2.0% - 2.5% ] 2.28% | 96,497 | 44.6% |
[ 2.0% - 2.5% ] 2.32% | 426,787 | 59.3% |
[ 2.0% - 2.5% ] 2.39% | 48,030 | 73.6% |
[ 2.0% - 2.5% ] 2.47% | 287,905 | 67.0% |
[ 2.5% - 3.0% ] 2.51% | 102,592 | 53.7% |
[ 2.5% - 3.0% ] 2.58% | 198,983 | 58.1% |
[ 2.5% - 3.0% ] 2.64% | 114,547 | 65.3% |
[ 2.5% - 3.0% ] 2.71% | 84,857 | 63.4% |
[ 2.5% - 3.0% ] 2.78% | 12,067 | 74.1% |
[ 2.5% - 3.0% ] 2.80% | 172,515 | 39.2% |
[ 2.5% - 3.0% ] 2.88% | 38,903 | 84.4% |
[ 2.5% - 3.0% ] 2.91% | 212,221 | 73.0% |
[ 3.0% - 3.5% ] 3.00% | 63,649 | 54.7% |
[ 3.0% - 3.5% ] 3.06% | 273,341 | 69.7% |
[ 3.0% - 3.5% ] 3.13% | 46,906 | 64.8% |
[ 3.0% - 3.5% ] 3.18% | 7,559 | 65.9% |
[ 3.0% - 3.5% ] 3.26% | 1,258 | 71.2% |
[ 3.0% - 3.5% ] 3.31% | 17,826 | 73.6% |
[ 3.0% - 3.5% ] 3.39% | 52,587 | 65.0% |
[ 3.0% - 3.5% ] 3.45% | 1,277 | 81.9% |
[ 3.0% - 3.5% ] 3.49% | 24,692 | 75.3% |
[ 3.5% - 4.0% ] 3.59% | 61,940 | 64.9% |
[ 3.5% - 4.0% ] 3.64% | 40,981 | 79.5% |
[ 3.5% - 4.0% ] 3.86% | 20,442 | 76.5% |
[ 3.5% - 4.0% ] 3.98% | 5,170 | 76.4% |
[ 4.0% - 4.5% ] 4.31% | 2,109 | 59.1% |
[ 4.0% - 4.5% ] 4.37% | 5,474 | 60.0% |
[ 4.0% - 4.5% ] 4.44% | 31,335 | 71.8% |
[ 4.0% - 4.5% ] 4.49% | 936 | 89.1% |
[ 4.5% - 5.0% ] 4.69% | 8,362 | 59.9% |
[ 4.5% - 5.0% ] 4.81% | 2,890 | 46.9% |
[ 4.5% - 5.0% ] 4.99% | 98,350 | 77.4% |
[ 5.0% - 5.5% ] 5.19% | 8,441 | 89.5% |
[ 5.0% - 5.5% ] 5.48% | 62,451 | 65.6% |
[ 5.5% - 6.0% ] 5.85% | 35,556 | 71.3% |
[ 6.0% - 6.5% ] 6.13% | 767 | 85.9% |
[ 6.0% - 6.5% ] 6.29% | 954 | 100.0% |
[ 6.0% - 6.5% ] 6.31% | 36,909 | 71.6% |
[ 6.0% - 6.5% ] 6.38% | 31,688 | 81.7% |
[ 6.0% - 6.5% ] 6.47% | 61,414 | 68.7% |
[ 6.5% - 7.0% ] 6.57% | 4,463 | 65.0% |
[ 6.5% - 7.0% ] 6.65% | 90,534 | 73.5% |
[ 6.5% - 7.0% ] 6.69% | 110,950 | 76.8% |
[ 6.5% - 7.0% ] 6.76% | 33,367 | 64.4% |
[ 6.5% - 7.0% ] 6.88% | 53,464 | 81.9% |
[ 7.0% - 7.5% ] 7.04% | 24,169 | 64.3% |
[ 7.5% - 8.0% ] 7.85% | 73,363 | 79.3% |
[ 7.5% - 8.0% ] 7.94% | 54,534 | 76.4% |
[ 8.0% - 8.5% ] 8.09% | 84,393 | 74.1% |
[ 8.0% - 8.5% ] 8.33% | 45,303 | 74.9% |
[ 8.5% - 9.0% ] 8.56% | 222 | 83.7% |
[ 9.0% - 9.5% ] 9.37% | 43,851 | 73.6% |
[ 9.0% - 9.5% ] 9.48% | 47,209 | 74.0% |
[ 11.5% - 12.0% ] 11.73% | 1,176 | 63.0% |
[ 12.0% - 12.5% ] 12.01% | 12,559 | 82.8% |
[ 12.0% - 12.5% ] 12.12% | 12,442 | 83.9% |