Immigrants from Somalia Disability Age Under 5
COMPARE
Immigrants from Somalia
Select to Compare
Disability Age Under 5
Immigrants from Somalia Disability Age Under 5
1.3%
DISABILITY | AGE UNDER 5
31.3/ 100
METRIC RATING
197th/ 347
METRIC RANK
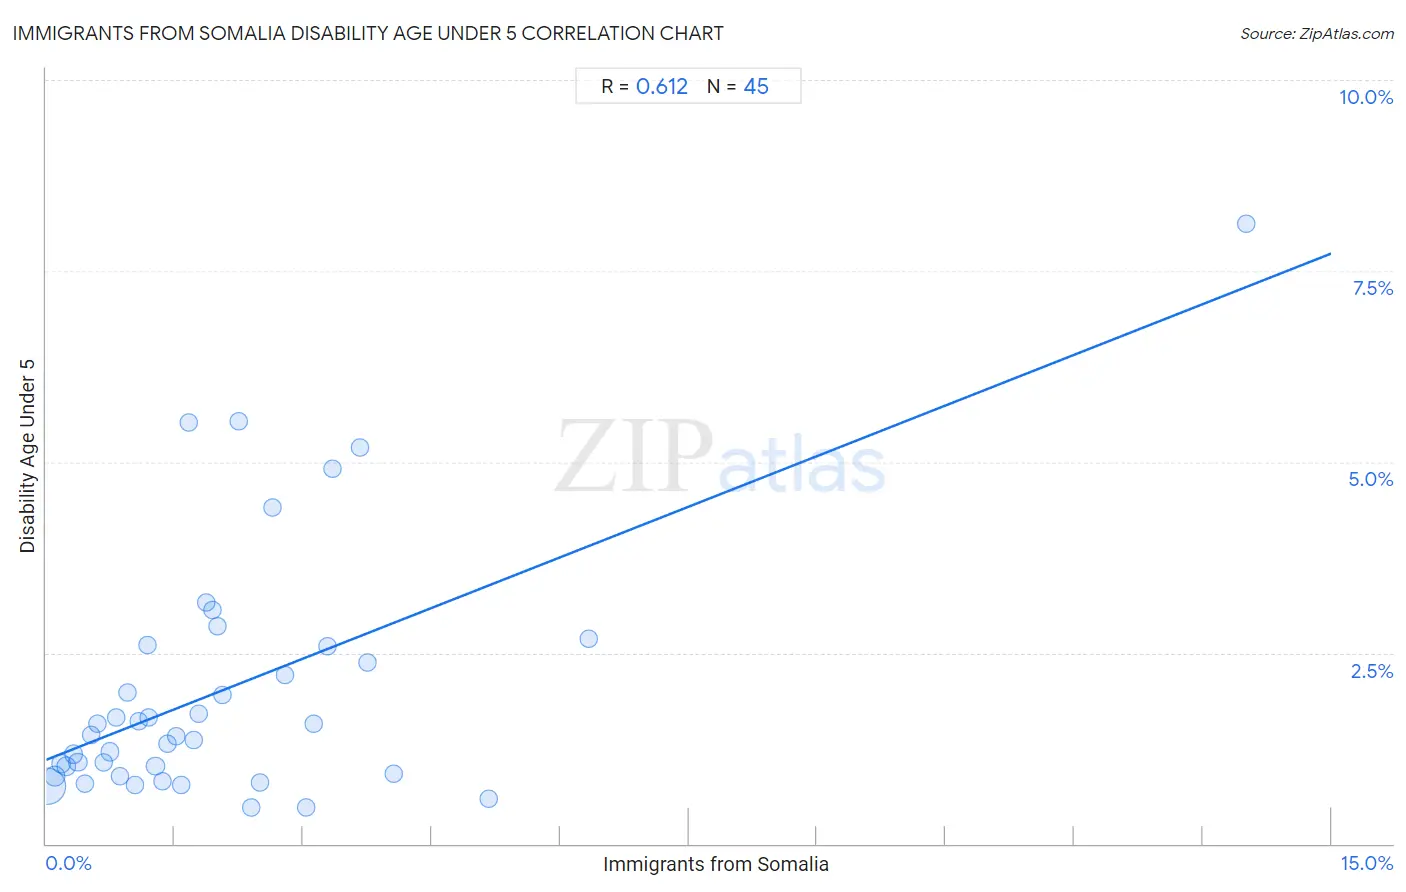
Immigrants from Somalia Disability Age Under 5 Correlation Chart
The statistical analysis conducted on geographies consisting of 75,075,754 people shows a significant positive correlation between the proportion of Immigrants from Somalia and percentage of population with a disability under the age of 5 in the United States with a correlation coefficient (R) of 0.612 and weighted average of 1.3%. On average, for every 1% (one percent) increase in Immigrants from Somalia within a typical geography, there is an increase of 0.44% in percentage of population with a disability under the age of 5.
It is essential to understand that the correlation between the percentage of Immigrants from Somalia and percentage of population with a disability under the age of 5 does not imply a direct cause-and-effect relationship. It remains uncertain whether the presence of Immigrants from Somalia influences an upward or downward trend in the level of percentage of population with a disability under the age of 5 within an area, or if Immigrants from Somalia simply ended up residing in those areas with higher or lower levels of percentage of population with a disability under the age of 5 due to other factors.
Demographics Similar to Immigrants from Somalia by Disability Age Under 5
In terms of disability age under 5, the demographic groups most similar to Immigrants from Somalia are Immigrants from Belgium (1.3%, a difference of 0.010%), Immigrants from Norway (1.3%, a difference of 0.030%), Jamaican (1.3%, a difference of 0.070%), U.S. Virgin Islander (1.3%, a difference of 0.31%), and Immigrants from North Macedonia (1.3%, a difference of 0.34%).
| Demographics | Rating | Rank | Disability Age Under 5 |
| Immigrants from Laos | 36.6 /100 | #190 | Fair 1.3% |
| Mexican American Indians | 36.6 /100 | #191 | Fair 1.3% |
| Immigrants from Bosnia and Herzegovina | 36.5 /100 | #192 | Fair 1.3% |
| Immigrants from Sierra Leone | 36.5 /100 | #193 | Fair 1.3% |
| Immigrants from North Macedonia | 34.7 /100 | #194 | Fair 1.3% |
| U.S. Virgin Islanders | 34.4 /100 | #195 | Fair 1.3% |
| Immigrants from Belgium | 31.4 /100 | #196 | Fair 1.3% |
| Immigrants from Somalia | 31.3 /100 | #197 | Fair 1.3% |
| Immigrants from Norway | 31.1 /100 | #198 | Fair 1.3% |
| Jamaicans | 30.7 /100 | #199 | Fair 1.3% |
| Immigrants from Lithuania | 27.2 /100 | #200 | Fair 1.3% |
| Immigrants from Italy | 25.4 /100 | #201 | Fair 1.3% |
| Arapaho | 24.1 /100 | #202 | Fair 1.3% |
| Liberians | 24.0 /100 | #203 | Fair 1.3% |
| Immigrants from Europe | 23.6 /100 | #204 | Fair 1.3% |
Immigrants from Somalia Disability Age Under 5 Correlation Summary
| Measurement | Immigrants from Somalia Data | Disability Age Under 5 Data |
| Minimum | 0.017% | 0.47% |
| Maximum | 14.0% | 8.1% |
| Range | 14.0% | 7.7% |
| Mean | 2.1% | 2.0% |
| Median | 1.6% | 1.4% |
| Interquartile 25% (IQ1) | 0.78% | 0.90% |
| Interquartile 75% (IQ3) | 2.7% | 2.6% |
| Interquartile Range (IQR) | 1.9% | 1.7% |
| Standard Deviation (Sample) | 2.3% | 1.6% |
| Standard Deviation (Population) | 2.3% | 1.6% |
Correlation Details
| Immigrants from Somalia Percentile | Sample Size | Disability Age Under 5 |
[ 0.0% - 0.5% ] 0.017% | 52,227,279 | 0.75% |
[ 0.0% - 0.5% ] 0.11% | 7,532,475 | 0.89% |
[ 0.0% - 0.5% ] 0.18% | 4,129,701 | 1.0% |
[ 0.0% - 0.5% ] 0.24% | 3,130,537 | 1.0% |
[ 0.0% - 0.5% ] 0.32% | 863,180 | 1.2% |
[ 0.0% - 0.5% ] 0.37% | 1,502,934 | 1.1% |
[ 0.0% - 0.5% ] 0.46% | 445,147 | 0.79% |
[ 0.5% - 1.0% ] 0.52% | 382,958 | 1.4% |
[ 0.5% - 1.0% ] 0.60% | 318,421 | 1.6% |
[ 0.5% - 1.0% ] 0.67% | 275,593 | 1.1% |
[ 0.5% - 1.0% ] 0.74% | 488,363 | 1.2% |
[ 0.5% - 1.0% ] 0.81% | 147,067 | 1.7% |
[ 0.5% - 1.0% ] 0.86% | 307,696 | 0.88% |
[ 0.5% - 1.0% ] 0.94% | 147,328 | 2.0% |
[ 1.0% - 1.5% ] 1.04% | 153,033 | 0.77% |
[ 1.0% - 1.5% ] 1.08% | 41,615 | 1.6% |
[ 1.0% - 1.5% ] 1.19% | 23,980 | 2.6% |
[ 1.0% - 1.5% ] 1.20% | 392,174 | 1.7% |
[ 1.0% - 1.5% ] 1.27% | 902,449 | 1.0% |
[ 1.0% - 1.5% ] 1.36% | 9,332 | 0.82% |
[ 1.0% - 1.5% ] 1.41% | 144,004 | 1.3% |
[ 1.5% - 2.0% ] 1.52% | 64,458 | 1.4% |
[ 1.5% - 2.0% ] 1.57% | 233,458 | 0.77% |
[ 1.5% - 2.0% ] 1.67% | 3,055 | 5.5% |
[ 1.5% - 2.0% ] 1.73% | 33,816 | 1.4% |
[ 1.5% - 2.0% ] 1.78% | 129,169 | 1.7% |
[ 1.5% - 2.0% ] 1.87% | 5,194 | 3.2% |
[ 1.5% - 2.0% ] 1.94% | 74,560 | 3.1% |
[ 1.5% - 2.0% ] 2.00% | 50,815 | 2.9% |
[ 2.0% - 2.5% ] 2.06% | 92,891 | 2.0% |
[ 2.0% - 2.5% ] 2.25% | 12,623 | 5.5% |
[ 2.0% - 2.5% ] 2.40% | 48,874 | 0.48% |
[ 2.0% - 2.5% ] 2.50% | 14,053 | 0.80% |
[ 2.5% - 3.0% ] 2.64% | 45,105 | 4.4% |
[ 2.5% - 3.0% ] 2.79% | 24,685 | 2.2% |
[ 3.0% - 3.5% ] 3.04% | 426,877 | 0.47% |
[ 3.0% - 3.5% ] 3.12% | 14,212 | 1.6% |
[ 3.0% - 3.5% ] 3.28% | 21,006 | 2.6% |
[ 3.0% - 3.5% ] 3.34% | 32,266 | 4.9% |
[ 3.5% - 4.0% ] 3.66% | 13,835 | 5.2% |
[ 3.5% - 4.0% ] 3.75% | 88,379 | 2.4% |
[ 4.0% - 4.5% ] 4.06% | 43,391 | 0.91% |
[ 5.0% - 5.5% ] 5.16% | 5,984 | 0.59% |
[ 6.0% - 6.5% ] 6.33% | 30,625 | 2.7% |
[ 14.0% - 14.5% ] 14.00% | 1,157 | 8.1% |