Immigrants from Somalia GED/Equivalency
COMPARE
Immigrants from Somalia
Select to Compare
GED/Equivalency
Immigrants from Somalia GED/Equivalency
84.8%
GED/EQUIVALENCY
10.6/ 100
METRIC RATING
212th/ 347
METRIC RANK
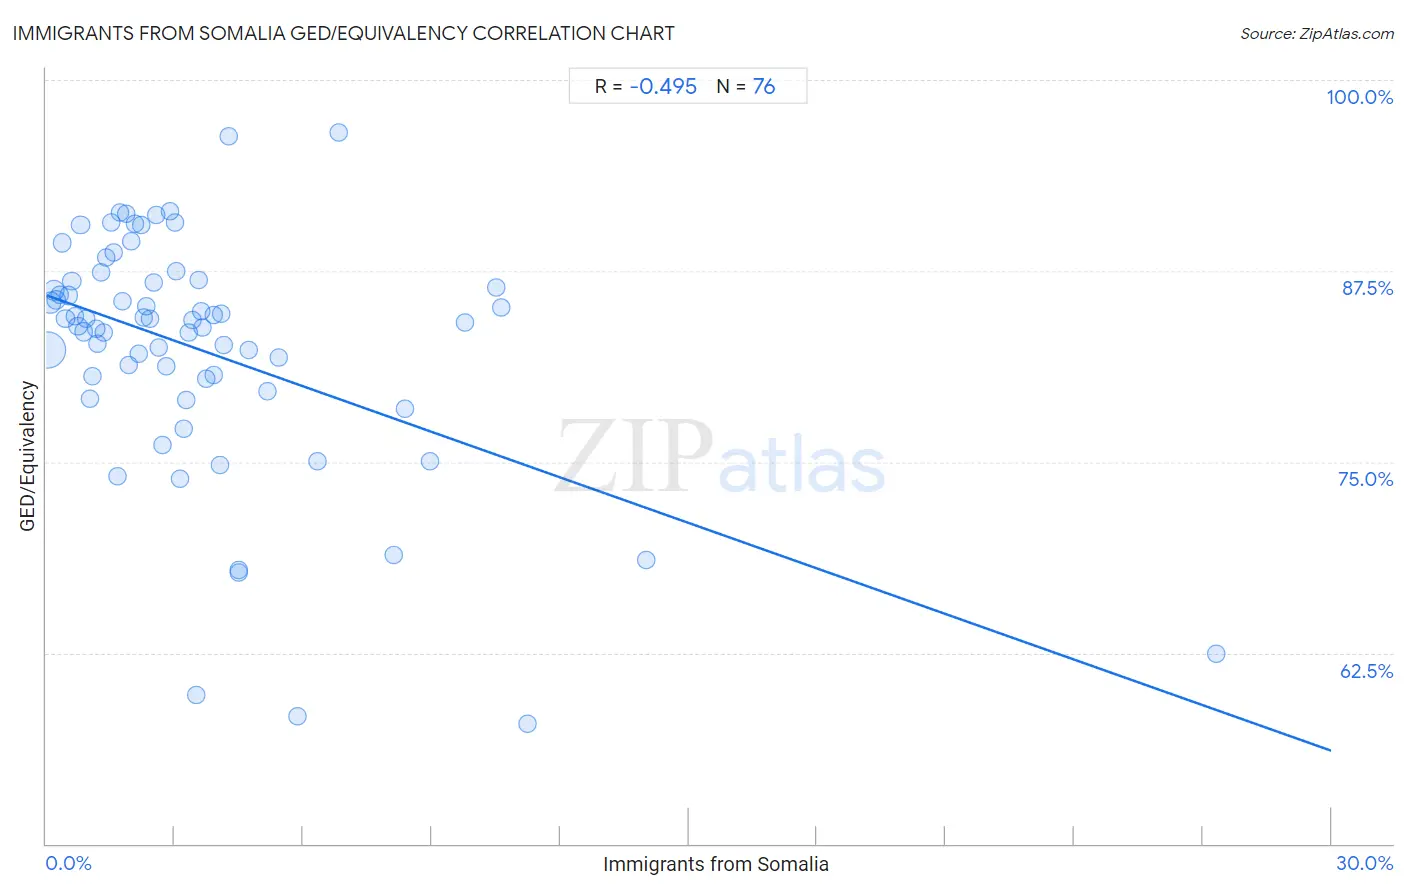
Immigrants from Somalia GED/Equivalency Correlation Chart
The statistical analysis conducted on geographies consisting of 92,111,755 people shows a moderate negative correlation between the proportion of Immigrants from Somalia and percentage of population with at least ged/equivalency education in the United States with a correlation coefficient (R) of -0.495 and weighted average of 84.8%. On average, for every 1% (one percent) increase in Immigrants from Somalia within a typical geography, there is a decrease of 0.99% in percentage of population with at least ged/equivalency education.
It is essential to understand that the correlation between the percentage of Immigrants from Somalia and percentage of population with at least ged/equivalency education does not imply a direct cause-and-effect relationship. It remains uncertain whether the presence of Immigrants from Somalia influences an upward or downward trend in the level of percentage of population with at least ged/equivalency education within an area, or if Immigrants from Somalia simply ended up residing in those areas with higher or lower levels of percentage of population with at least ged/equivalency education due to other factors.
Demographics Similar to Immigrants from Somalia by GED/Equivalency
In terms of ged/equivalency, the demographic groups most similar to Immigrants from Somalia are South American (84.8%, a difference of 0.020%), Immigrants from Philippines (84.8%, a difference of 0.030%), Osage (84.8%, a difference of 0.060%), Immigrants from Cameroon (84.9%, a difference of 0.080%), and Peruvian (84.7%, a difference of 0.080%).
| Demographics | Rating | Rank | GED/Equivalency |
| Liberians | 14.6 /100 | #205 | Poor 85.0% |
| Samoans | 13.7 /100 | #206 | Poor 84.9% |
| Hmong | 13.1 /100 | #207 | Poor 84.9% |
| Marshallese | 12.5 /100 | #208 | Poor 84.9% |
| Colombians | 12.3 /100 | #209 | Poor 84.9% |
| Immigrants from Cameroon | 12.1 /100 | #210 | Poor 84.9% |
| South Americans | 10.9 /100 | #211 | Poor 84.8% |
| Immigrants from Somalia | 10.6 /100 | #212 | Poor 84.8% |
| Immigrants from Philippines | 10.0 /100 | #213 | Poor 84.8% |
| Osage | 9.5 /100 | #214 | Tragic 84.8% |
| Peruvians | 9.2 /100 | #215 | Tragic 84.7% |
| Immigrants from Micronesia | 8.7 /100 | #216 | Tragic 84.7% |
| Nigerians | 8.6 /100 | #217 | Tragic 84.7% |
| Alaska Natives | 8.6 /100 | #218 | Tragic 84.7% |
| Potawatomi | 8.2 /100 | #219 | Tragic 84.7% |
Immigrants from Somalia GED/Equivalency Correlation Summary
| Measurement | Immigrants from Somalia Data | GED/Equivalency Data |
| Minimum | 0.018% | 57.9% |
| Maximum | 27.3% | 96.6% |
| Range | 27.3% | 38.7% |
| Mean | 3.6% | 82.3% |
| Median | 2.7% | 84.2% |
| Interquartile 25% (IQ1) | 1.3% | 80.0% |
| Interquartile 75% (IQ3) | 4.1% | 86.8% |
| Interquartile Range (IQR) | 2.8% | 6.8% |
| Standard Deviation (Sample) | 4.0% | 8.0% |
| Standard Deviation (Population) | 4.0% | 7.9% |
Correlation Details
| Immigrants from Somalia Percentile | Sample Size | GED/Equivalency |
[ 0.0% - 0.5% ] 0.018% | 57,933,864 | 82.4% |
[ 0.0% - 0.5% ] 0.10% | 10,768,448 | 85.4% |
[ 0.0% - 0.5% ] 0.18% | 5,858,148 | 86.2% |
[ 0.0% - 0.5% ] 0.24% | 4,545,141 | 85.6% |
[ 0.0% - 0.5% ] 0.31% | 1,492,284 | 85.9% |
[ 0.0% - 0.5% ] 0.37% | 1,988,208 | 89.3% |
[ 0.0% - 0.5% ] 0.45% | 832,727 | 84.4% |
[ 0.5% - 1.0% ] 0.52% | 608,126 | 85.9% |
[ 0.5% - 1.0% ] 0.60% | 635,989 | 86.8% |
[ 0.5% - 1.0% ] 0.67% | 500,964 | 84.5% |
[ 0.5% - 1.0% ] 0.74% | 639,860 | 83.9% |
[ 0.5% - 1.0% ] 0.80% | 471,196 | 90.5% |
[ 0.5% - 1.0% ] 0.86% | 537,236 | 83.5% |
[ 0.5% - 1.0% ] 0.94% | 233,534 | 84.4% |
[ 1.0% - 1.5% ] 1.03% | 209,423 | 79.1% |
[ 1.0% - 1.5% ] 1.07% | 140,406 | 80.6% |
[ 1.0% - 1.5% ] 1.16% | 119,914 | 83.7% |
[ 1.0% - 1.5% ] 1.21% | 458,328 | 82.7% |
[ 1.0% - 1.5% ] 1.28% | 967,131 | 87.4% |
[ 1.0% - 1.5% ] 1.35% | 51,488 | 83.5% |
[ 1.0% - 1.5% ] 1.41% | 238,741 | 88.4% |
[ 1.5% - 2.0% ] 1.50% | 203,501 | 90.7% |
[ 1.5% - 2.0% ] 1.57% | 242,134 | 88.7% |
[ 1.5% - 2.0% ] 1.65% | 39,564 | 74.0% |
[ 1.5% - 2.0% ] 1.72% | 128,441 | 91.3% |
[ 1.5% - 2.0% ] 1.79% | 207,559 | 85.6% |
[ 1.5% - 2.0% ] 1.86% | 86,966 | 91.2% |
[ 1.5% - 2.0% ] 1.94% | 78,564 | 81.3% |
[ 1.5% - 2.0% ] 1.99% | 99,000 | 89.4% |
[ 2.0% - 2.5% ] 2.06% | 170,632 | 90.6% |
[ 2.0% - 2.5% ] 2.16% | 56,020 | 82.0% |
[ 2.0% - 2.5% ] 2.21% | 25,299 | 90.5% |
[ 2.0% - 2.5% ] 2.27% | 29,001 | 84.5% |
[ 2.0% - 2.5% ] 2.32% | 24,790 | 85.2% |
[ 2.0% - 2.5% ] 2.41% | 85,038 | 84.4% |
[ 2.5% - 3.0% ] 2.51% | 40,813 | 86.8% |
[ 2.5% - 3.0% ] 2.56% | 7,066 | 91.1% |
[ 2.5% - 3.0% ] 2.64% | 45,105 | 82.5% |
[ 2.5% - 3.0% ] 2.72% | 2,245 | 76.1% |
[ 2.5% - 3.0% ] 2.79% | 24,685 | 81.2% |
[ 2.5% - 3.0% ] 2.89% | 8,923 | 91.4% |
[ 2.5% - 3.0% ] 3.00% | 36,473 | 90.6% |
[ 3.0% - 3.5% ] 3.04% | 439,052 | 87.5% |
[ 3.0% - 3.5% ] 3.12% | 14,212 | 73.9% |
[ 3.0% - 3.5% ] 3.22% | 21,569 | 77.2% |
[ 3.0% - 3.5% ] 3.28% | 21,006 | 79.0% |
[ 3.0% - 3.5% ] 3.34% | 32,266 | 83.4% |
[ 3.0% - 3.5% ] 3.40% | 23,785 | 84.3% |
[ 3.0% - 3.5% ] 3.49% | 10,662 | 59.7% |
[ 3.5% - 4.0% ] 3.56% | 68,910 | 86.9% |
[ 3.5% - 4.0% ] 3.62% | 49,196 | 84.8% |
[ 3.5% - 4.0% ] 3.65% | 48,985 | 83.8% |
[ 3.5% - 4.0% ] 3.75% | 100,849 | 80.4% |
[ 3.5% - 4.0% ] 3.91% | 30,927 | 80.7% |
[ 3.5% - 4.0% ] 3.92% | 30,938 | 84.6% |
[ 4.0% - 4.5% ] 4.06% | 43,391 | 74.8% |
[ 4.0% - 4.5% ] 4.08% | 81,929 | 84.7% |
[ 4.0% - 4.5% ] 4.13% | 27,523 | 82.7% |
[ 4.0% - 4.5% ] 4.25% | 6,968 | 96.3% |
[ 4.0% - 4.5% ] 4.48% | 2,589 | 67.9% |
[ 4.0% - 4.5% ] 4.48% | 4,842 | 67.7% |
[ 4.5% - 5.0% ] 4.73% | 39,177 | 82.3% |
[ 5.0% - 5.5% ] 5.16% | 5,984 | 79.6% |
[ 5.0% - 5.5% ] 5.43% | 40,898 | 81.9% |
[ 5.5% - 6.0% ] 5.87% | 1,005 | 58.3% |
[ 6.0% - 6.5% ] 6.33% | 30,625 | 75.1% |
[ 6.5% - 7.0% ] 6.84% | 234 | 96.6% |
[ 8.0% - 8.5% ] 8.10% | 790 | 68.9% |
[ 8.0% - 8.5% ] 8.37% | 3,693 | 78.5% |
[ 8.5% - 9.0% ] 8.96% | 28,172 | 75.0% |
[ 9.5% - 10.0% ] 9.77% | 8,290 | 84.1% |
[ 10.5% - 11.0% ] 10.52% | 7,703 | 86.4% |
[ 10.5% - 11.0% ] 10.62% | 631 | 85.1% |
[ 11.0% - 11.5% ] 11.24% | 1,930 | 57.9% |
[ 14.0% - 14.5% ] 14.00% | 1,157 | 68.6% |
[ 27.0% - 27.5% ] 27.31% | 8,892 | 62.5% |