Immigrants from Morocco 2 or more Vehicles in Household
COMPARE
Immigrants from Morocco
Select to Compare
2 or more Vehicles in Household
Immigrants from Morocco 2 or more Vehicles in Household
50.3%
2+ VEHICLES AVAILABLE
0.0/ 100
METRIC RATING
299th/ 347
METRIC RANK
Immigrants from Morocco 2 or more Vehicles in Household Correlation Chart
The statistical analysis conducted on geographies consisting of 178,909,930 people shows a poor positive correlation between the proportion of Immigrants from Morocco and percentage of households with 2 or more vehicles available in the United States with a correlation coefficient (R) of 0.191 and weighted average of 50.3%. On average, for every 1% (one percent) increase in Immigrants from Morocco within a typical geography, there is an increase of 0.69% in percentage of households with 2 or more vehicles available.
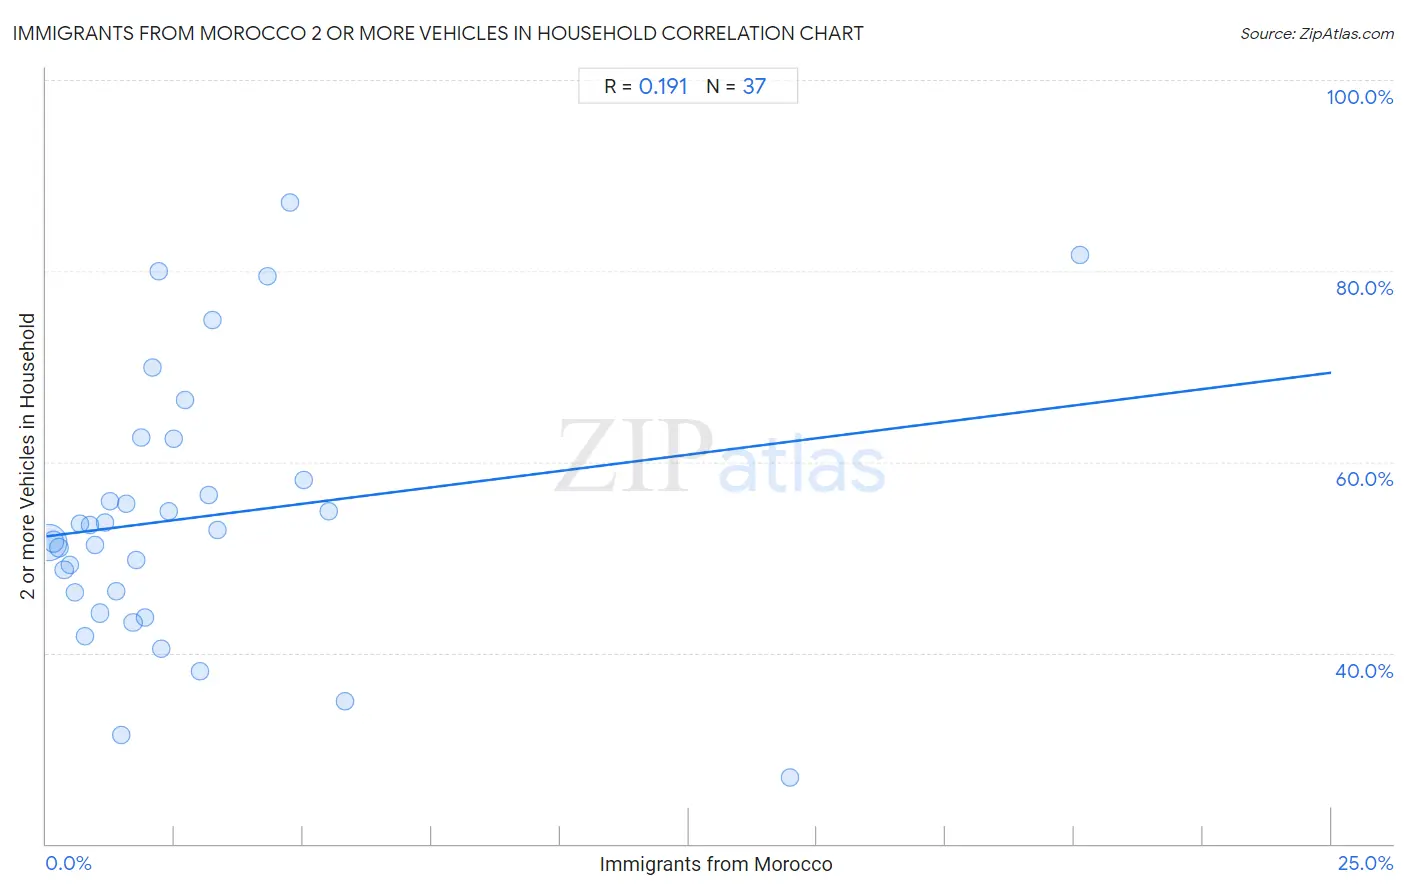
It is essential to understand that the correlation between the percentage of Immigrants from Morocco and percentage of households with 2 or more vehicles available does not imply a direct cause-and-effect relationship. It remains uncertain whether the presence of Immigrants from Morocco influences an upward or downward trend in the level of percentage of households with 2 or more vehicles available within an area, or if Immigrants from Morocco simply ended up residing in those areas with higher or lower levels of percentage of households with 2 or more vehicles available due to other factors.
Demographics Similar to Immigrants from Morocco by 2 or more Vehicles in Household
In terms of 2 or more vehicles in household, the demographic groups most similar to Immigrants from Morocco are Paraguayan (50.3%, a difference of 0.030%), Immigrants from Russia (50.3%, a difference of 0.040%), Immigrants from Spain (50.4%, a difference of 0.16%), Immigrants from Greece (50.2%, a difference of 0.22%), and Immigrants from South America (50.2%, a difference of 0.28%).
| Demographics | Rating | Rank | 2 or more Vehicles in Household |
| Immigrants from Ukraine | 0.0 /100 | #292 | Tragic 50.9% |
| Blacks/African Americans | 0.0 /100 | #293 | Tragic 50.9% |
| Bermudans | 0.0 /100 | #294 | Tragic 50.6% |
| Cypriots | 0.0 /100 | #295 | Tragic 50.6% |
| Immigrants from Somalia | 0.0 /100 | #296 | Tragic 50.5% |
| Immigrants from Spain | 0.0 /100 | #297 | Tragic 50.4% |
| Paraguayans | 0.0 /100 | #298 | Tragic 50.3% |
| Immigrants from Morocco | 0.0 /100 | #299 | Tragic 50.3% |
| Immigrants from Russia | 0.0 /100 | #300 | Tragic 50.3% |
| Immigrants from Greece | 0.0 /100 | #301 | Tragic 50.2% |
| Immigrants from South America | 0.0 /100 | #302 | Tragic 50.2% |
| Tohono O'odham | 0.0 /100 | #303 | Tragic 50.0% |
| Immigrants from Belize | 0.0 /100 | #304 | Tragic 49.9% |
| Immigrants from Western Africa | 0.0 /100 | #305 | Tragic 49.4% |
| Immigrants from Israel | 0.0 /100 | #306 | Tragic 49.2% |
Immigrants from Morocco 2 or more Vehicles in Household Correlation Summary
| Measurement | Immigrants from Morocco Data | 2 or more Vehicles in Household Data |
| Minimum | 0.040% | 27.0% |
| Maximum | 20.1% | 87.2% |
| Range | 20.1% | 60.2% |
| Mean | 2.9% | 54.2% |
| Median | 1.8% | 52.9% |
| Interquartile 25% (IQ1) | 0.91% | 45.2% |
| Interquartile 75% (IQ3) | 3.2% | 60.3% |
| Interquartile Range (IQR) | 2.3% | 15.0% |
| Standard Deviation (Sample) | 3.9% | 13.9% |
| Standard Deviation (Population) | 3.8% | 13.7% |
Correlation Details
| Immigrants from Morocco Percentile | Sample Size | 2 or more Vehicles in Household |
[ 0.0% - 0.5% ] 0.040% | 140,164,148 | 51.6% |
[ 0.0% - 0.5% ] 0.14% | 21,990,434 | 51.6% |
[ 0.0% - 0.5% ] 0.24% | 6,978,386 | 51.0% |
[ 0.0% - 0.5% ] 0.35% | 2,808,774 | 48.7% |
[ 0.0% - 0.5% ] 0.45% | 1,874,100 | 49.2% |
[ 0.5% - 1.0% ] 0.55% | 1,762,049 | 46.3% |
[ 0.5% - 1.0% ] 0.66% | 779,669 | 53.5% |
[ 0.5% - 1.0% ] 0.75% | 865,891 | 41.7% |
[ 0.5% - 1.0% ] 0.86% | 378,600 | 53.4% |
[ 0.5% - 1.0% ] 0.95% | 294,174 | 51.4% |
[ 1.0% - 1.5% ] 1.05% | 254,252 | 44.2% |
[ 1.0% - 1.5% ] 1.15% | 132,535 | 53.6% |
[ 1.0% - 1.5% ] 1.25% | 92,241 | 55.9% |
[ 1.0% - 1.5% ] 1.36% | 84,292 | 46.4% |
[ 1.0% - 1.5% ] 1.47% | 74,049 | 31.4% |
[ 1.5% - 2.0% ] 1.55% | 55,312 | 55.6% |
[ 1.5% - 2.0% ] 1.69% | 183,497 | 43.2% |
[ 1.5% - 2.0% ] 1.74% | 11,637 | 49.7% |
[ 1.5% - 2.0% ] 1.84% | 3,591 | 62.6% |
[ 1.5% - 2.0% ] 1.93% | 33,016 | 43.7% |
[ 2.0% - 2.5% ] 2.06% | 9,683 | 69.9% |
[ 2.0% - 2.5% ] 2.19% | 320 | 80.0% |
[ 2.0% - 2.5% ] 2.25% | 979 | 40.5% |
[ 2.0% - 2.5% ] 2.39% | 14,619 | 54.8% |
[ 2.0% - 2.5% ] 2.48% | 4,350 | 62.5% |
[ 2.5% - 3.0% ] 2.69% | 20,155 | 66.5% |
[ 2.5% - 3.0% ] 2.98% | 19,531 | 38.1% |
[ 3.0% - 3.5% ] 3.16% | 1,804 | 56.5% |
[ 3.0% - 3.5% ] 3.24% | 5,121 | 74.9% |
[ 3.0% - 3.5% ] 3.34% | 1,975 | 52.9% |
[ 4.0% - 4.5% ] 4.30% | 465 | 79.4% |
[ 4.5% - 5.0% ] 4.74% | 548 | 87.2% |
[ 5.0% - 5.5% ] 5.02% | 5,120 | 58.0% |
[ 5.5% - 6.0% ] 5.51% | 890 | 54.8% |
[ 5.5% - 6.0% ] 5.81% | 2,566 | 35.0% |
[ 14.0% - 14.5% ] 14.46% | 332 | 27.0% |
[ 20.0% - 20.5% ] 20.12% | 825 | 81.7% |