Immigrants from Eastern Africa Wage/Income Gap
COMPARE
Immigrants from Eastern Africa
Select to Compare
Wage/Income Gap
Immigrants from Eastern Africa Wage/Income Gap
22.8%
WAGE/INCOME GAP
99.9/ 100
METRIC RATING
73rd/ 347
METRIC RANK
Immigrants from Eastern Africa Wage/Income Gap Correlation Chart
The statistical analysis conducted on geographies consisting of 355,004,605 people shows a poor positive correlation between the proportion of Immigrants from Eastern Africa and wage/income gap percentage in the United States with a correlation coefficient (R) of 0.175 and weighted average of 22.8%. On average, for every 1% (one percent) increase in Immigrants from Eastern Africa within a typical geography, there is an increase of 0.23% in wage/income gap percentage.
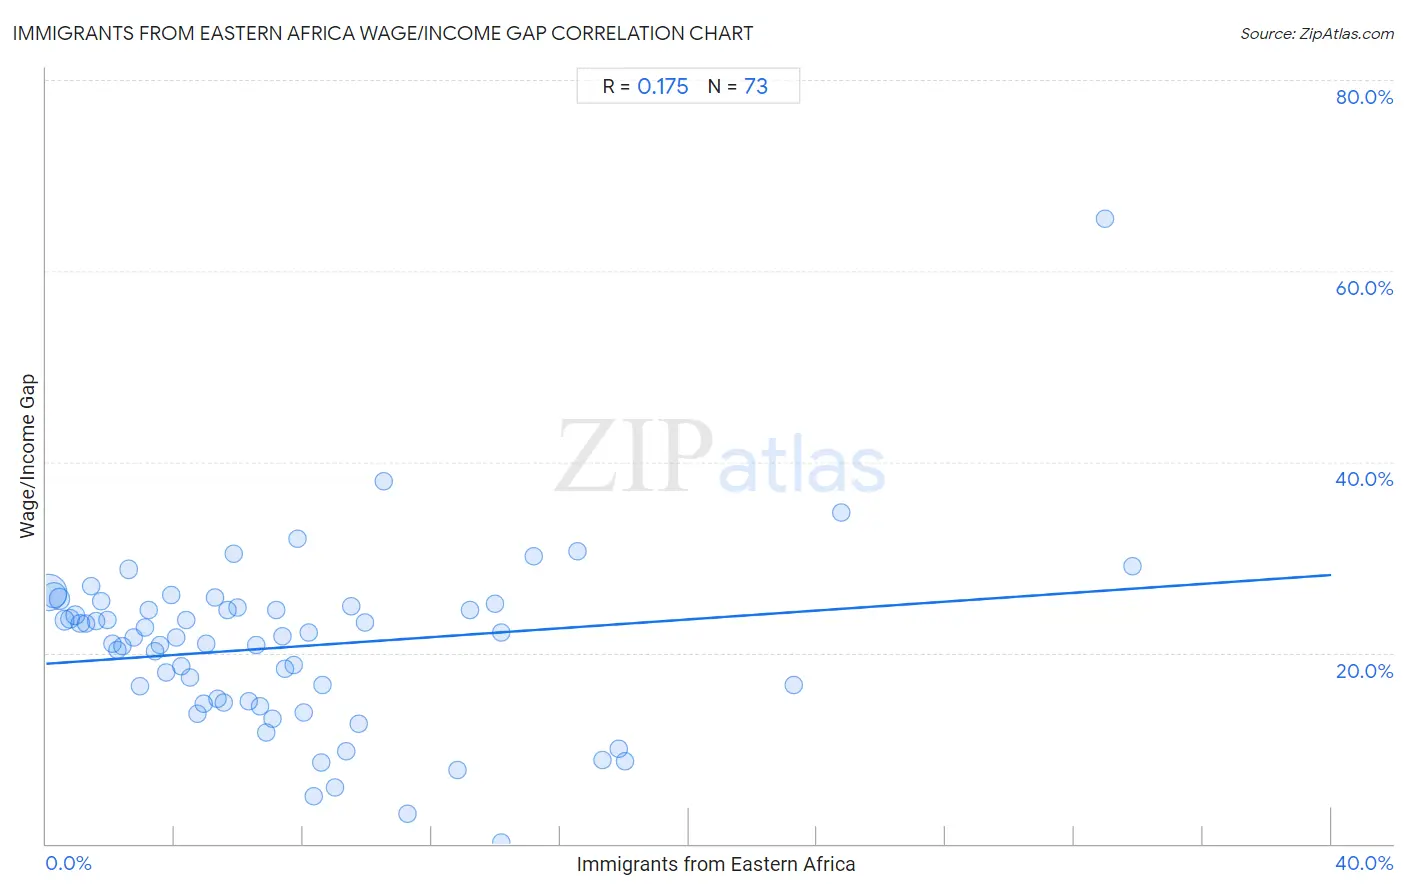
It is essential to understand that the correlation between the percentage of Immigrants from Eastern Africa and wage/income gap percentage does not imply a direct cause-and-effect relationship. It remains uncertain whether the presence of Immigrants from Eastern Africa influences an upward or downward trend in the level of wage/income gap percentage within an area, or if Immigrants from Eastern Africa simply ended up residing in those areas with higher or lower levels of wage/income gap percentage due to other factors.
Demographics Similar to Immigrants from Eastern Africa by Wage/Income Gap
In terms of wage/income gap, the demographic groups most similar to Immigrants from Eastern Africa are Subsaharan African (22.8%, a difference of 0.030%), Immigrants from Burma/Myanmar (22.8%, a difference of 0.080%), Immigrants from El Salvador (22.8%, a difference of 0.18%), Immigrants from Uzbekistan (22.7%, a difference of 0.34%), and Fijian (22.9%, a difference of 0.36%).
| Demographics | Rating | Rank | Wage/Income Gap |
| Central American Indians | 99.9 /100 | #66 | Exceptional 22.7% |
| Menominee | 99.9 /100 | #67 | Exceptional 22.7% |
| Immigrants from Nigeria | 99.9 /100 | #68 | Exceptional 22.7% |
| Indonesians | 99.9 /100 | #69 | Exceptional 22.7% |
| Immigrants from Uzbekistan | 99.9 /100 | #70 | Exceptional 22.7% |
| Immigrants from El Salvador | 99.9 /100 | #71 | Exceptional 22.8% |
| Sub-Saharan Africans | 99.9 /100 | #72 | Exceptional 22.8% |
| Immigrants from Eastern Africa | 99.9 /100 | #73 | Exceptional 22.8% |
| Immigrants from Burma/Myanmar | 99.9 /100 | #74 | Exceptional 22.8% |
| Fijians | 99.9 /100 | #75 | Exceptional 22.9% |
| Ecuadorians | 99.9 /100 | #76 | Exceptional 22.9% |
| Africans | 99.9 /100 | #77 | Exceptional 22.9% |
| Nigerians | 99.9 /100 | #78 | Exceptional 23.0% |
| Immigrants from Nicaragua | 99.9 /100 | #79 | Exceptional 23.0% |
| Salvadorans | 99.9 /100 | #80 | Exceptional 23.0% |
Immigrants from Eastern Africa Wage/Income Gap Correlation Summary
| Measurement | Immigrants from Eastern Africa Data | Wage/Income Gap Data |
| Minimum | 0.073% | 0.17% |
| Maximum | 33.8% | 65.4% |
| Range | 33.7% | 65.3% |
| Mean | 7.7% | 20.7% |
| Median | 6.0% | 21.6% |
| Interquartile 25% (IQ1) | 3.0% | 14.9% |
| Interquartile 75% (IQ3) | 9.6% | 24.8% |
| Interquartile Range (IQR) | 6.6% | 9.9% |
| Standard Deviation (Sample) | 6.9% | 9.1% |
| Standard Deviation (Population) | 6.9% | 9.1% |
Correlation Details
| Immigrants from Eastern Africa Percentile | Sample Size | Wage/Income Gap |
[ 0.0% - 0.5% ] 0.073% | 181,349,696 | 26.3% |
[ 0.0% - 0.5% ] 0.23% | 69,895,093 | 26.0% |
[ 0.0% - 0.5% ] 0.41% | 33,878,343 | 25.6% |
[ 0.5% - 1.0% ] 0.57% | 20,740,267 | 23.5% |
[ 0.5% - 1.0% ] 0.74% | 11,292,731 | 23.6% |
[ 0.5% - 1.0% ] 0.90% | 6,857,452 | 23.9% |
[ 1.0% - 1.5% ] 1.06% | 5,289,561 | 23.0% |
[ 1.0% - 1.5% ] 1.24% | 4,516,223 | 23.0% |
[ 1.0% - 1.5% ] 1.39% | 2,026,908 | 26.9% |
[ 1.5% - 2.0% ] 1.56% | 3,412,693 | 23.3% |
[ 1.5% - 2.0% ] 1.72% | 1,512,846 | 25.4% |
[ 1.5% - 2.0% ] 1.91% | 965,598 | 23.4% |
[ 2.0% - 2.5% ] 2.06% | 1,466,027 | 21.0% |
[ 2.0% - 2.5% ] 2.22% | 1,492,418 | 20.3% |
[ 2.0% - 2.5% ] 2.37% | 1,667,129 | 20.7% |
[ 2.5% - 3.0% ] 2.56% | 635,258 | 28.7% |
[ 2.5% - 3.0% ] 2.71% | 677,863 | 21.6% |
[ 2.5% - 3.0% ] 2.92% | 703,227 | 16.5% |
[ 3.0% - 3.5% ] 3.06% | 671,003 | 22.6% |
[ 3.0% - 3.5% ] 3.20% | 259,382 | 24.4% |
[ 3.0% - 3.5% ] 3.40% | 444,685 | 20.2% |
[ 3.5% - 4.0% ] 3.55% | 561,207 | 20.9% |
[ 3.5% - 4.0% ] 3.72% | 785,492 | 17.9% |
[ 3.5% - 4.0% ] 3.88% | 266,089 | 26.0% |
[ 4.0% - 4.5% ] 4.06% | 187,429 | 21.6% |
[ 4.0% - 4.5% ] 4.21% | 64,819 | 18.6% |
[ 4.0% - 4.5% ] 4.35% | 145,660 | 23.4% |
[ 4.0% - 4.5% ] 4.48% | 311,340 | 17.5% |
[ 4.5% - 5.0% ] 4.71% | 372,083 | 13.6% |
[ 4.5% - 5.0% ] 4.90% | 583,075 | 14.7% |
[ 4.5% - 5.0% ] 4.99% | 146,510 | 21.0% |
[ 5.0% - 5.5% ] 5.27% | 20,037 | 25.8% |
[ 5.0% - 5.5% ] 5.34% | 146,778 | 15.1% |
[ 5.5% - 6.0% ] 5.52% | 149,843 | 14.8% |
[ 5.5% - 6.0% ] 5.66% | 60,781 | 24.5% |
[ 5.5% - 6.0% ] 5.82% | 8,232 | 30.4% |
[ 5.5% - 6.0% ] 5.97% | 32,524 | 24.7% |
[ 6.0% - 6.5% ] 6.31% | 44,512 | 14.9% |
[ 6.5% - 7.0% ] 6.52% | 141,127 | 20.8% |
[ 6.5% - 7.0% ] 6.67% | 167,562 | 14.4% |
[ 6.5% - 7.0% ] 6.87% | 114,071 | 11.6% |
[ 7.0% - 7.5% ] 7.04% | 81,317 | 13.1% |
[ 7.0% - 7.5% ] 7.16% | 40,566 | 24.5% |
[ 7.0% - 7.5% ] 7.35% | 75,527 | 21.7% |
[ 7.0% - 7.5% ] 7.44% | 112,595 | 18.3% |
[ 7.5% - 8.0% ] 7.71% | 121,282 | 18.8% |
[ 7.5% - 8.0% ] 7.84% | 14,521 | 32.0% |
[ 8.0% - 8.5% ] 8.01% | 73,858 | 13.8% |
[ 8.0% - 8.5% ] 8.18% | 20,561 | 22.1% |
[ 8.0% - 8.5% ] 8.33% | 19,531 | 4.9% |
[ 8.5% - 9.0% ] 8.56% | 25,823 | 8.6% |
[ 8.5% - 9.0% ] 8.62% | 86,918 | 16.6% |
[ 8.5% - 9.0% ] 8.97% | 535 | 5.9% |
[ 9.0% - 9.5% ] 9.33% | 24,308 | 9.7% |
[ 9.0% - 9.5% ] 9.48% | 42,084 | 24.8% |
[ 9.5% - 10.0% ] 9.74% | 5,655 | 12.6% |
[ 9.5% - 10.0% ] 9.92% | 30,625 | 23.2% |
[ 10.5% - 11.0% ] 10.52% | 1,312 | 37.9% |
[ 11.0% - 11.5% ] 11.24% | 1,930 | 3.1% |
[ 12.5% - 13.0% ] 12.79% | 30,927 | 7.7% |
[ 13.0% - 13.5% ] 13.17% | 8,290 | 24.5% |
[ 13.5% - 14.0% ] 13.95% | 28,172 | 25.1% |
[ 14.0% - 14.5% ] 14.17% | 27,523 | 0.17% |
[ 14.0% - 14.5% ] 14.18% | 7,703 | 22.2% |
[ 15.0% - 15.5% ] 15.16% | 4,280 | 30.1% |
[ 16.5% - 17.0% ] 16.54% | 133 | 30.6% |
[ 17.0% - 17.5% ] 17.33% | 75 | 8.8% |
[ 17.5% - 18.0% ] 17.82% | 26,684 | 9.9% |
[ 18.0% - 18.5% ] 18.03% | 14,553 | 8.7% |
[ 23.0% - 23.5% ] 23.25% | 4,572 | 16.7% |
[ 24.5% - 25.0% ] 24.74% | 97 | 34.7% |
[ 32.5% - 33.0% ] 32.97% | 182 | 65.4% |
[ 33.5% - 34.0% ] 33.82% | 8,892 | 29.1% |