Immigrants from Eastern Africa vs Eastern European Disability Age 5 to 17

COMPARE

Immigrants from Eastern Africa
Race
Ancestry
AfghanAfricanAlaska NativeAlaskan AthabascanAlbanianAleutAlsatianAmericanApacheArabArapahoArgentineanArmenianAssyrian/Chaldean/SyriacAustralianAustrianBahamianBangladeshiBarbadianBasqueBelgianBelizeanBermudanBhutaneseBlackfeetBolivianBrazilianBritishBritish West IndianBulgarianBurmeseCajunCambodianCanadianCape VerdeanCarpatho RusynCelticCentral AmericanCentral American IndianCherokeeCheyenneChickasawChileanChineseChippewaChoctawColombianColvilleComancheCosta RicanCreeCreekCroatianCrowCubanCypriotCzechCzechoslovakianDanishDelawareDominicanDutchDutch West IndianEcuadorianEgyptianEnglishEstonianEthiopianEuropeanFijianFilipinoFinnishFrenchFrench American IndianFrench CanadianGermanGerman RussianGhanaianGreekGuamanian/ChamorroGuatemalanGuyaneseHaitianHmongHonduranHopiHoumaHungarianIcelanderIndian (Asian)IndonesianInupiatIranianIraqiIrishIroquoisIsraeliItalianJamaicanJapaneseJordanianKenyanKiowaKoreanLaotianLatvianLebaneseLiberianLithuanianLumbeeLuxembourgerMacedonianMalaysianMalteseMarshalleseMenomineeMexicanMexican American IndianMongolianMoroccanNative HawaiianNavajoNepaleseNew ZealanderNicaraguanNigerianNorthern EuropeanNorwegianOkinawanOsageOttawaPaiutePakistaniPalestinianPanamanianParaguayanPennsylvania GermanPeruvianPimaPolishPortuguesePotawatomiPuebloPuerto RicanPuget Sound SalishRomanianRussianSalvadoranSamoanScandinavianScotch-IrishScottishSeminoleSenegaleseSerbianShoshoneSierra LeoneanSiouxSlavicSlovakSloveneSomaliSouth AfricanSouth AmericanSouth American IndianSoviet UnionSpaniardSpanishSpanish AmericanSpanish American IndianSri LankanSubsaharan AfricanSudaneseSwedishSwissSyrianTaiwaneseThaiTlingit-HaidaTohono O'OdhamTonganTrinidadian and TobagonianTsimshianTurkishU.S. Virgin IslanderUgandanUkrainianUruguayanUteVenezuelanVietnameseWelshWest IndianYakamaYaquiYugoslavianYumanYup'ikZimbabwean
Immigration
NonimmigrantsImmigrantsAfghanistanAfricaAlbaniaArgentinaArmeniaAsiaAustraliaAustriaBahamasBangladeshBarbadosBelarusBelgiumBelizeBoliviaBosnia and HerzegovinaBrazilBulgariaBurma/MyanmarCabo VerdeCambodiaCameroonCanadaCaribbeanCentral AmericaChileChinaColombiaCongoCosta RicaCroatiaCubaCzechoslovakiaDenmarkDominicaDominican RepublicEastern AfricaEastern AsiaEastern EuropeEcuadorEgyptEl SalvadorEnglandEritreaEthiopiaEuropeFijiFranceGermanyGhanaGreeceGrenadaGuatemalaGuyanaHaitiHondurasHong KongHungaryIndiaIndonesiaIranIraqIrelandIsraelItalyJamaicaJapanJordanKazakhstanKenyaKoreaKuwaitLaosLatin AmericaLatviaLebanonLiberiaLithuaniaMalaysiaMexicoMicronesiaMiddle AfricaMoldovaMoroccoNepalNetherlandsNicaraguaNigeriaNorth AmericaNorth MacedoniaNorthern AfricaNorthern EuropeNorwayOceaniaPakistanPanamaPeruPhilippinesPolandPortugalRomaniaRussiaSaudi ArabiaScotlandSenegalSerbiaSierra LeoneSingaporeSomaliaSouth AfricaSouth AmericaSouth Central AsiaSouth Eastern AsiaSouthern EuropeSpainSri LankaSt. Vincent and the GrenadinesSudanSwedenSwitzerlandSyriaTaiwanThailandTrinidad and TobagoTurkeyUgandaUkraineUruguayUzbekistanVenezuelaVietnamWest IndiesWestern AfricaWestern AsiaWestern EuropeYemenZaireZimbabweAzores
Eastern European
Race
Ancestry
AfghanAfricanAlaska NativeAlaskan AthabascanAlbanianAleutAlsatianAmericanApacheArabArapahoArgentineanArmenianAssyrian/Chaldean/SyriacAustralianAustrianBahamianBangladeshiBarbadianBasqueBelgianBelizeanBermudanBhutaneseBlackfeetBolivianBrazilianBritishBritish West IndianBulgarianBurmeseCajunCambodianCanadianCape VerdeanCarpatho RusynCelticCentral AmericanCentral American IndianCherokeeCheyenneChickasawChileanChineseChippewaChoctawColombianColvilleComancheCosta RicanCreeCreekCroatianCrowCubanCypriotCzechCzechoslovakianDanishDelawareDominicanDutchDutch West IndianEastern EuropeanEcuadorianEgyptianEnglishEstonianEthiopianEuropeanFijianFilipinoFinnishFrenchFrench American IndianFrench CanadianGermanGerman RussianGhanaianGreekGuamanian/ChamorroGuatemalanGuyaneseHaitianHmongHonduranHopiHoumaHungarianIcelanderIndian (Asian)IndonesianInupiatIranianIraqiIrishIroquoisIsraeliItalianJamaicanJapaneseJordanianKenyanKiowaKoreanLaotianLatvianLebaneseLiberianLithuanianLumbeeLuxembourgerMacedonianMalaysianMalteseMarshalleseMenomineeMexicanMexican American IndianMongolianMoroccanNative HawaiianNavajoNepaleseNew ZealanderNicaraguanNigerianNorthern EuropeanNorwegianOkinawanOsageOttawaPaiutePakistaniPalestinianPanamanianParaguayanPennsylvania GermanPeruvianPimaPolishPortuguesePotawatomiPuebloPuerto RicanPuget Sound SalishRomanianRussianSalvadoranSamoanScandinavianScotch-IrishScottishSeminoleSenegaleseSerbianShoshoneSierra LeoneanSiouxSlavicSlovakSloveneSomaliSouth AfricanSouth AmericanSouth American IndianSoviet UnionSpaniardSpanishSpanish AmericanSpanish American IndianSri LankanSubsaharan AfricanSudaneseSwedishSwissSyrianTaiwaneseThaiTlingit-HaidaTohono O'OdhamTonganTrinidadian and TobagonianTsimshianTurkishU.S. Virgin IslanderUgandanUkrainianUruguayanUteVenezuelanVietnameseWelshWest IndianYakamaYaquiYugoslavianYumanYup'ikZimbabwean
Immigration
NonimmigrantsImmigrantsAfghanistanAfricaAlbaniaArgentinaArmeniaAsiaAustraliaAustriaBahamasBangladeshBarbadosBelarusBelgiumBelizeBoliviaBosnia and HerzegovinaBrazilBulgariaBurma/MyanmarCabo VerdeCambodiaCameroonCanadaCaribbeanCentral AmericaChileChinaColombiaCongoCosta RicaCroatiaCubaCzechoslovakiaDenmarkDominicaDominican RepublicEastern AsiaEastern EuropeEcuadorEgyptEl SalvadorEnglandEritreaEthiopiaEuropeFijiFranceGermanyGhanaGreeceGrenadaGuatemalaGuyanaHaitiHondurasHong KongHungaryIndiaIndonesiaIranIraqIrelandIsraelItalyJamaicaJapanJordanKazakhstanKenyaKoreaKuwaitLaosLatin AmericaLatviaLebanonLiberiaLithuaniaMalaysiaMexicoMicronesiaMiddle AfricaMoldovaMoroccoNepalNetherlandsNicaraguaNigeriaNorth AmericaNorth MacedoniaNorthern AfricaNorthern EuropeNorwayOceaniaPakistanPanamaPeruPhilippinesPolandPortugalRomaniaRussiaSaudi ArabiaScotlandSenegalSerbiaSierra LeoneSingaporeSomaliaSouth AfricaSouth AmericaSouth Central AsiaSouth Eastern AsiaSouthern EuropeSpainSri LankaSt. Vincent and the GrenadinesSudanSwedenSwitzerlandSyriaTaiwanThailandTrinidad and TobagoTurkeyUgandaUkraineUruguayUzbekistanVenezuelaVietnamWest IndiesWestern AfricaWestern AsiaWestern EuropeYemenZaireZimbabweAzores
Disability Age 5 to 17
Income
Poverty
Unemployment
Labor Participation
Family Structure
Vehicle Availability
Education Level
Disability

Disability Age 5 to 17 Comparison

Immigrants from Eastern Africa

Eastern Europeans

Fair
Exceptional
5.7%
DISABILITY AGE 5 TO 17
27.3/ 100
METRIC RATING
190th/ 347
METRIC RANK
5.2%
DISABILITY AGE 5 TO 17
99.4/ 100
METRIC RATING
87th/ 347
METRIC RANK

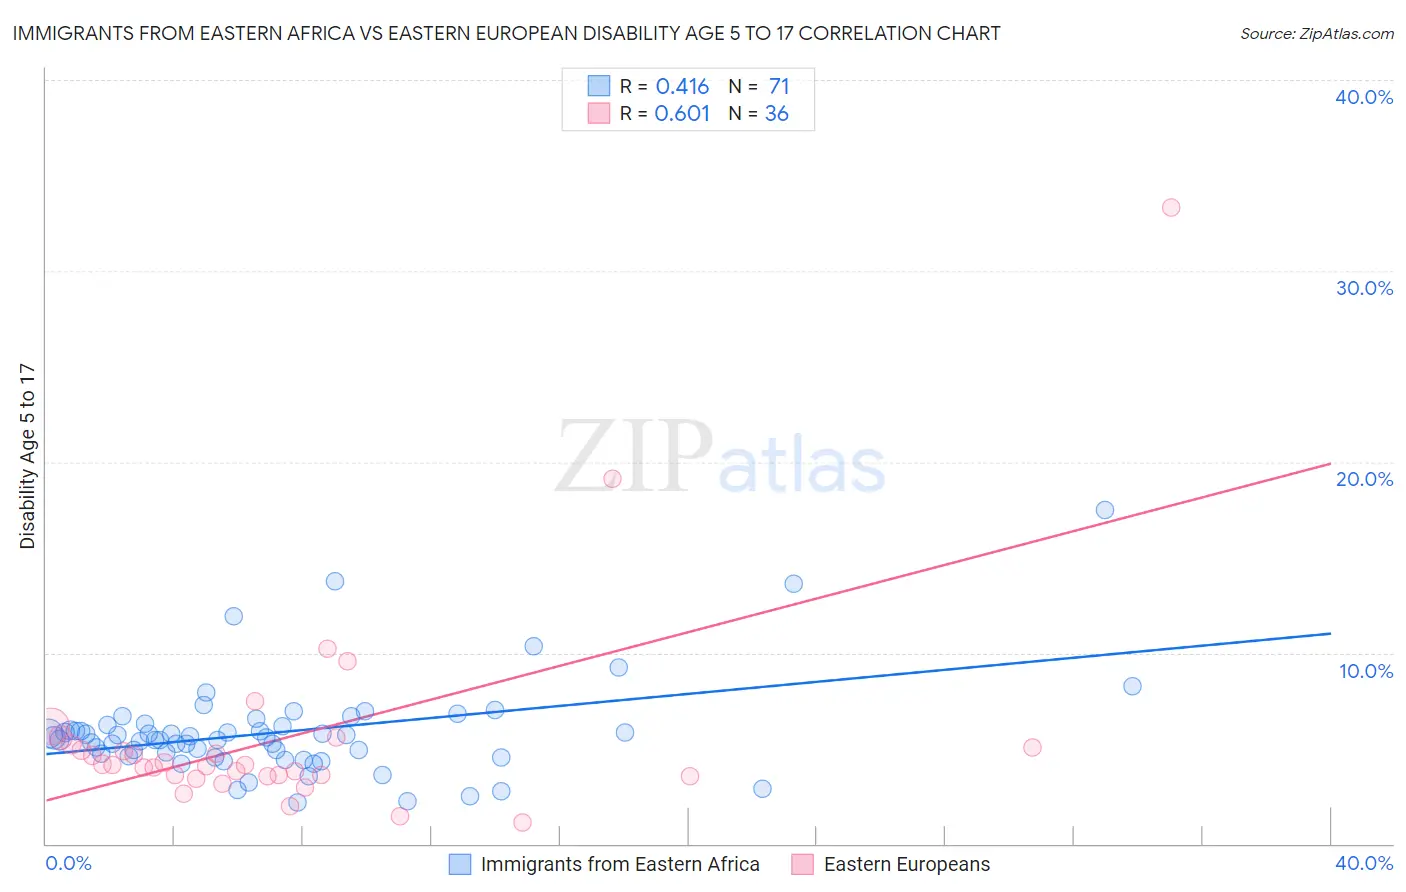
Immigrants from Eastern Africa vs Eastern European Disability Age 5 to 17 Correlation Chart

The statistical analysis conducted on geographies consisting of 352,956,874 people shows a moderate positive correlation between the proportion of Immigrants from Eastern Africa and percentage of population with a disability between the ages 5 and 17 in the United States with a correlation coefficient (R) of 0.416 and weighted average of 5.7%. Similarly, the statistical analysis conducted on geographies consisting of 455,060,458 people shows a significant positive correlation between the proportion of Eastern Europeans and percentage of population with a disability between the ages 5 and 17 in the United States with a correlation coefficient (R) of 0.601 and weighted average of 5.2%, a difference of 8.0%.
Immigrants from Eastern Africa vs Eastern European Disability Age 5 to 17

Disability Age 5 to 17 Correlation Summary

MeasurementImmigrants from Eastern AfricaEastern European
Minimum2.1%1.1%
Maximum17.5%33.3%
Range15.3%32.2%
Mean5.9%5.6%
Median5.5%4.1%
Interquartile 25% (IQ1)4.6%3.6%
Interquartile 75% (IQ3)6.2%5.1%
Interquartile Range (IQR)1.7%1.6%
Standard Deviation (Sample)2.6%5.6%
Standard Deviation (Population)2.5%5.6%

Similar Demographics by Disability Age 5 to 17

Demographics Similar to Immigrants from Eastern Africa by Disability Age 5 to 17

In terms of disability age 5 to 17, the demographic groups most similar to Immigrants from Eastern Africa are Pueblo (5.7%, a difference of 0.010%), Marshallese (5.7%, a difference of 0.050%), Danish (5.7%, a difference of 0.050%), Immigrants from Bosnia and Herzegovina (5.7%, a difference of 0.060%), and Immigrants from Canada (5.7%, a difference of 0.080%).
DemographicsRating | RankDisability Age 5 to 17
Immigrants | Latin America
34.3
/100
|
#183
Fair
5.6%
Syrians
33.8
/100
|
#184
Fair
5.6%
Immigrants | Mexico
33.7
/100
|
#185
Fair
5.6%
Fijians
31.7
/100
|
#186
Fair
5.7%
Immigrants | Thailand
30.2
/100
|
#187
Fair
5.7%
Marshallese
28.1
/100
|
#188
Fair
5.7%
Pueblo
27.5
/100
|
#189
Fair
5.7%
Immigrants | Eastern Africa
27.3
/100
|
#190
Fair
5.7%
Danes
26.5
/100
|
#191
Fair
5.7%
Immigrants | Bosnia and Herzegovina
26.3
/100
|
#192
Fair
5.7%
Immigrants | Canada
26.1
/100
|
#193
Fair
5.7%
Croatians
23.6
/100
|
#194
Fair
5.7%
Immigrants | Nigeria
23.4
/100
|
#195
Fair
5.7%
Inupiat
23.3
/100
|
#196
Fair
5.7%
Immigrants | North America
23.1
/100
|
#197
Fair
5.7%

Demographics Similar to Eastern Europeans by Disability Age 5 to 17

In terms of disability age 5 to 17, the demographic groups most similar to Eastern Europeans are Immigrants from Croatia (5.2%, a difference of 0.030%), Immigrants from Spain (5.2%, a difference of 0.030%), Immigrants from St. Vincent and the Grenadines (5.2%, a difference of 0.040%), Bulgarian (5.2%, a difference of 0.080%), and Immigrants from Kuwait (5.3%, a difference of 0.080%).
DemographicsRating | RankDisability Age 5 to 17
Sri Lankans
99.6
/100
|
#80
Exceptional
5.2%
Native Hawaiians
99.6
/100
|
#81
Exceptional
5.2%
Immigrants | Sweden
99.5
/100
|
#82
Exceptional
5.2%
Immigrants | France
99.5
/100
|
#83
Exceptional
5.2%
Immigrants | Nicaragua
99.5
/100
|
#84
Exceptional
5.2%
Bulgarians
99.4
/100
|
#85
Exceptional
5.2%
Immigrants | St. Vincent and the Grenadines
99.4
/100
|
#86
Exceptional
5.2%
Eastern Europeans
99.4
/100
|
#87
Exceptional
5.2%
Immigrants | Croatia
99.4
/100
|
#88
Exceptional
5.2%
Immigrants | Spain
99.4
/100
|
#89
Exceptional
5.2%
Immigrants | Kuwait
99.4
/100
|
#90
Exceptional
5.3%
Mongolians
99.2
/100
|
#91
Exceptional
5.3%
Luxembourgers
99.2
/100
|
#92
Exceptional
5.3%
Immigrants | Peru
99.1
/100
|
#93
Exceptional
5.3%
Immigrants | Jordan
99.1
/100
|
#94
Exceptional
5.3%