Immigrants from Cuba Married-couple Households
COMPARE
Immigrants from Cuba
Select to Compare
Married-couple Households
Immigrants from Cuba Married-couple Households
44.2%
MARRIED-COUPLE HOUSEHOLDS
0.6/ 100
METRIC RATING
246th/ 347
METRIC RANK
Immigrants from Cuba Married-couple Households Correlation Chart
The statistical analysis conducted on geographies consisting of 325,949,905 people shows a poor positive correlation between the proportion of Immigrants from Cuba and percentage of married-couple family households in the United States with a correlation coefficient (R) of 0.114 and weighted average of 44.2%. On average, for every 1% (one percent) increase in Immigrants from Cuba within a typical geography, there is an increase of 0.054% in percentage of married-couple family households.
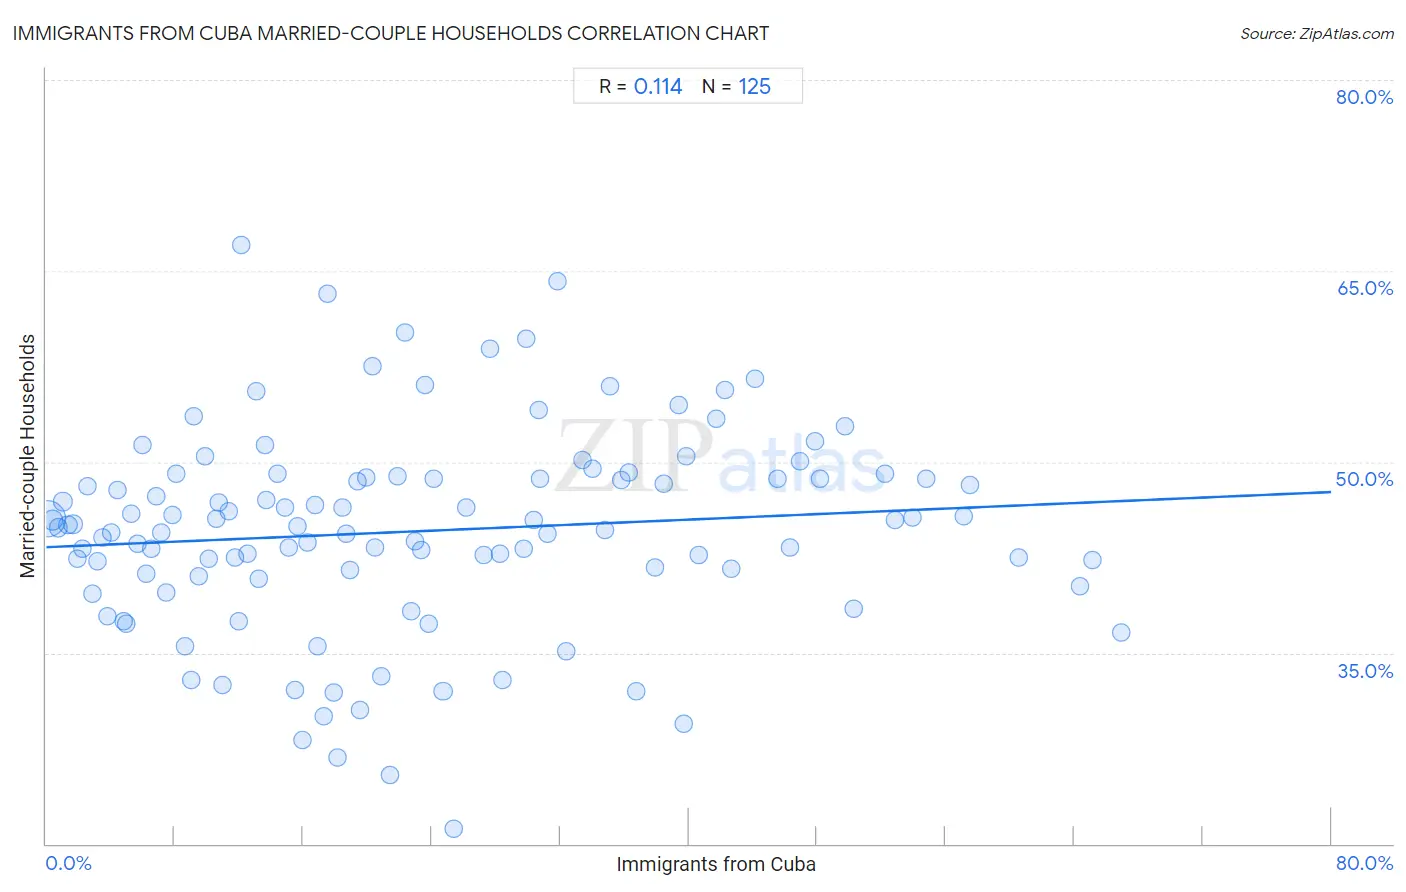
It is essential to understand that the correlation between the percentage of Immigrants from Cuba and percentage of married-couple family households does not imply a direct cause-and-effect relationship. It remains uncertain whether the presence of Immigrants from Cuba influences an upward or downward trend in the level of percentage of married-couple family households within an area, or if Immigrants from Cuba simply ended up residing in those areas with higher or lower levels of percentage of married-couple family households due to other factors.
Demographics Similar to Immigrants from Cuba by Married-couple Households
In terms of married-couple households, the demographic groups most similar to Immigrants from Cuba are Immigrants from Morocco (44.2%, a difference of 0.0%), Immigrants from El Salvador (44.3%, a difference of 0.15%), Immigrants from Armenia (44.3%, a difference of 0.16%), Yup'ik (44.1%, a difference of 0.28%), and Immigrants from Kenya (44.1%, a difference of 0.33%).
| Demographics | Rating | Rank | Married-couple Households |
| Spanish Americans | 1.1 /100 | #239 | Tragic 44.5% |
| Ute | 1.0 /100 | #240 | Tragic 44.4% |
| Immigrants from Bosnia and Herzegovina | 1.0 /100 | #241 | Tragic 44.4% |
| Immigrants from Albania | 1.0 /100 | #242 | Tragic 44.4% |
| Immigrants from Saudi Arabia | 0.9 /100 | #243 | Tragic 44.4% |
| Immigrants from Armenia | 0.7 /100 | #244 | Tragic 44.3% |
| Immigrants from El Salvador | 0.7 /100 | #245 | Tragic 44.3% |
| Immigrants from Cuba | 0.6 /100 | #246 | Tragic 44.2% |
| Immigrants from Morocco | 0.6 /100 | #247 | Tragic 44.2% |
| Yup'ik | 0.4 /100 | #248 | Tragic 44.1% |
| Immigrants from Kenya | 0.4 /100 | #249 | Tragic 44.1% |
| French American Indians | 0.4 /100 | #250 | Tragic 44.1% |
| German Russians | 0.4 /100 | #251 | Tragic 44.0% |
| Seminole | 0.4 /100 | #252 | Tragic 44.0% |
| Central Americans | 0.3 /100 | #253 | Tragic 43.9% |
Immigrants from Cuba Married-couple Households Correlation Summary
| Measurement | Immigrants from Cuba Data | Married-couple Households Data |
| Minimum | 0.095% | 21.2% |
| Maximum | 66.9% | 67.0% |
| Range | 66.8% | 45.8% |
| Mean | 23.3% | 44.6% |
| Median | 19.5% | 44.9% |
| Interquartile 25% (IQ1) | 9.7% | 41.1% |
| Interquartile 75% (IQ3) | 34.9% | 48.7% |
| Interquartile Range (IQR) | 25.2% | 7.6% |
| Standard Deviation (Sample) | 16.8% | 8.0% |
| Standard Deviation (Population) | 16.8% | 8.0% |
Correlation Details
| Immigrants from Cuba Percentile | Sample Size | Married-couple Households |
[ 0.0% - 0.5% ] 0.095% | 252,936,698 | 45.5% |
[ 0.0% - 0.5% ] 0.43% | 30,420,558 | 45.4% |
[ 0.5% - 1.0% ] 0.74% | 11,818,055 | 44.8% |
[ 1.0% - 1.5% ] 1.04% | 6,689,368 | 46.9% |
[ 1.0% - 1.5% ] 1.35% | 4,297,240 | 45.1% |
[ 1.5% - 2.0% ] 1.66% | 2,698,571 | 45.1% |
[ 1.5% - 2.0% ] 1.96% | 2,724,296 | 42.4% |
[ 2.0% - 2.5% ] 2.29% | 1,242,174 | 43.2% |
[ 2.5% - 3.0% ] 2.57% | 788,704 | 48.1% |
[ 2.5% - 3.0% ] 2.88% | 1,016,250 | 39.6% |
[ 3.0% - 3.5% ] 3.19% | 651,653 | 42.2% |
[ 3.0% - 3.5% ] 3.50% | 594,381 | 44.1% |
[ 3.5% - 4.0% ] 3.78% | 657,122 | 37.9% |
[ 4.0% - 4.5% ] 4.06% | 276,005 | 44.4% |
[ 4.0% - 4.5% ] 4.47% | 201,301 | 47.8% |
[ 4.5% - 5.0% ] 4.79% | 663,030 | 37.5% |
[ 5.0% - 5.5% ] 5.01% | 362,351 | 37.3% |
[ 5.0% - 5.5% ] 5.29% | 355,191 | 46.0% |
[ 5.5% - 6.0% ] 5.66% | 401,062 | 43.6% |
[ 5.5% - 6.0% ] 5.96% | 245,797 | 51.3% |
[ 6.0% - 6.5% ] 6.19% | 325,497 | 41.3% |
[ 6.5% - 7.0% ] 6.54% | 179,865 | 43.1% |
[ 6.5% - 7.0% ] 6.81% | 396,450 | 47.3% |
[ 7.0% - 7.5% ] 7.16% | 52,407 | 44.5% |
[ 7.0% - 7.5% ] 7.47% | 214,479 | 39.7% |
[ 7.5% - 8.0% ] 7.82% | 287,202 | 45.8% |
[ 8.0% - 8.5% ] 8.06% | 118,840 | 49.1% |
[ 8.5% - 9.0% ] 8.62% | 38,761 | 35.5% |
[ 9.0% - 9.5% ] 9.05% | 24,360 | 32.9% |
[ 9.0% - 9.5% ] 9.15% | 48,890 | 53.6% |
[ 9.5% - 10.0% ] 9.52% | 119,826 | 41.0% |
[ 9.5% - 10.0% ] 9.90% | 76,717 | 50.4% |
[ 10.0% - 10.5% ] 10.08% | 69,663 | 42.4% |
[ 10.5% - 11.0% ] 10.56% | 181,514 | 45.6% |
[ 10.5% - 11.0% ] 10.71% | 80,262 | 46.8% |
[ 11.0% - 11.5% ] 11.01% | 59,796 | 32.4% |
[ 11.0% - 11.5% ] 11.37% | 114,298 | 46.2% |
[ 11.5% - 12.0% ] 11.73% | 26,898 | 42.5% |
[ 11.5% - 12.0% ] 11.97% | 107,716 | 37.5% |
[ 12.0% - 12.5% ] 12.18% | 38,774 | 67.0% |
[ 12.5% - 13.0% ] 12.54% | 63,572 | 42.8% |
[ 13.0% - 13.5% ] 13.05% | 15,218 | 55.5% |
[ 13.0% - 13.5% ] 13.23% | 149,277 | 40.8% |
[ 13.5% - 14.0% ] 13.59% | 35,710 | 51.3% |
[ 13.5% - 14.0% ] 13.71% | 34,336 | 47.0% |
[ 14.0% - 14.5% ] 14.38% | 63,743 | 49.1% |
[ 14.5% - 15.0% ] 14.89% | 10,581 | 46.4% |
[ 15.0% - 15.5% ] 15.09% | 318 | 43.3% |
[ 15.0% - 15.5% ] 15.46% | 82,400 | 32.1% |
[ 15.5% - 16.0% ] 15.63% | 117,849 | 44.9% |
[ 15.5% - 16.0% ] 15.97% | 24,257 | 28.2% |
[ 16.0% - 16.5% ] 16.25% | 106,757 | 43.7% |
[ 16.5% - 17.0% ] 16.71% | 10,992 | 46.6% |
[ 16.5% - 17.0% ] 16.88% | 10,656 | 35.5% |
[ 17.0% - 17.5% ] 17.25% | 47,065 | 30.0% |
[ 17.5% - 18.0% ] 17.50% | 18,719 | 63.2% |
[ 17.5% - 18.0% ] 17.88% | 59,121 | 31.8% |
[ 18.0% - 18.5% ] 18.13% | 26,717 | 26.8% |
[ 18.0% - 18.5% ] 18.42% | 170,587 | 46.4% |
[ 18.5% - 19.0% ] 18.65% | 115,926 | 44.3% |
[ 18.5% - 19.0% ] 18.93% | 48,849 | 41.5% |
[ 19.0% - 19.5% ] 19.36% | 100,975 | 48.5% |
[ 19.5% - 20.0% ] 19.54% | 11,943 | 30.5% |
[ 19.5% - 20.0% ] 19.95% | 143,303 | 48.8% |
[ 20.0% - 20.5% ] 20.29% | 85,659 | 57.5% |
[ 20.0% - 20.5% ] 20.48% | 581 | 43.2% |
[ 20.5% - 21.0% ] 20.82% | 52,197 | 33.2% |
[ 21.0% - 21.5% ] 21.43% | 32,946 | 25.4% |
[ 21.5% - 22.0% ] 21.84% | 16,776 | 48.9% |
[ 22.0% - 22.5% ] 22.36% | 8,617 | 60.1% |
[ 22.5% - 23.0% ] 22.72% | 27,033 | 38.2% |
[ 22.5% - 23.0% ] 22.97% | 24,179 | 43.8% |
[ 23.0% - 23.5% ] 23.35% | 26,549 | 43.1% |
[ 23.5% - 24.0% ] 23.59% | 84,418 | 56.1% |
[ 23.5% - 24.0% ] 23.82% | 15,182 | 37.3% |
[ 24.0% - 24.5% ] 24.15% | 57,327 | 48.6% |
[ 24.5% - 25.0% ] 24.71% | 463,011 | 32.0% |
[ 25.0% - 25.5% ] 25.34% | 8,989 | 21.2% |
[ 26.0% - 26.5% ] 26.13% | 2,419 | 46.4% |
[ 27.0% - 27.5% ] 27.25% | 73,954 | 42.6% |
[ 27.5% - 28.0% ] 27.62% | 36,964 | 58.9% |
[ 28.0% - 28.5% ] 28.25% | 37,958 | 42.8% |
[ 28.0% - 28.5% ] 28.43% | 60,573 | 32.9% |
[ 29.5% - 30.0% ] 29.74% | 68,517 | 43.2% |
[ 29.5% - 30.0% ] 29.86% | 144 | 59.7% |
[ 30.0% - 30.5% ] 30.32% | 80,505 | 45.4% |
[ 30.5% - 31.0% ] 30.65% | 40,718 | 54.1% |
[ 30.5% - 31.0% ] 30.73% | 86,031 | 48.7% |
[ 31.0% - 31.5% ] 31.17% | 40,278 | 44.3% |
[ 31.5% - 32.0% ] 31.79% | 5,303 | 64.2% |
[ 32.0% - 32.5% ] 32.40% | 2,318 | 35.1% |
[ 33.0% - 33.5% ] 33.42% | 30,621 | 50.2% |
[ 34.0% - 34.5% ] 34.03% | 35,767 | 49.5% |
[ 34.5% - 35.0% ] 34.79% | 57,066 | 44.7% |
[ 35.0% - 35.5% ] 35.07% | 60,279 | 56.0% |
[ 35.5% - 36.0% ] 35.78% | 37,977 | 48.6% |
[ 36.0% - 36.5% ] 36.29% | 3,400 | 49.1% |
[ 36.5% - 37.0% ] 36.74% | 54,873 | 32.0% |
[ 37.5% - 38.0% ] 37.92% | 7,713 | 41.7% |
[ 38.0% - 38.5% ] 38.43% | 43,702 | 48.3% |
[ 39.0% - 39.5% ] 39.35% | 34,057 | 54.5% |
[ 39.5% - 40.0% ] 39.68% | 34,742 | 29.4% |
[ 39.5% - 40.0% ] 39.87% | 49,483 | 50.5% |
[ 40.5% - 41.0% ] 40.65% | 34,335 | 42.7% |
[ 41.5% - 42.0% ] 41.73% | 13,824 | 53.4% |
[ 42.0% - 42.5% ] 42.27% | 52,661 | 55.6% |
[ 42.5% - 43.0% ] 42.62% | 19,399 | 41.7% |
[ 44.0% - 44.5% ] 44.13% | 55,241 | 56.5% |
[ 45.5% - 46.0% ] 45.55% | 24,597 | 48.6% |
[ 46.0% - 46.5% ] 46.31% | 40,739 | 43.3% |
[ 46.5% - 47.0% ] 46.90% | 10,725 | 50.1% |
[ 47.5% - 48.0% ] 47.86% | 52,851 | 51.7% |
[ 48.0% - 48.5% ] 48.15% | 53,765 | 48.7% |
[ 49.5% - 50.0% ] 49.72% | 50,233 | 52.8% |
[ 50.0% - 50.5% ] 50.26% | 46,798 | 38.5% |
[ 52.0% - 52.5% ] 52.20% | 52,047 | 49.0% |
[ 52.5% - 53.0% ] 52.80% | 45,620 | 45.5% |
[ 53.5% - 54.0% ] 53.93% | 22,815 | 45.7% |
[ 54.5% - 55.0% ] 54.81% | 20,850 | 48.7% |
[ 57.0% - 57.5% ] 57.14% | 77 | 45.7% |
[ 57.5% - 58.0% ] 57.54% | 26,596 | 48.2% |
[ 60.5% - 61.0% ] 60.57% | 224,014 | 42.5% |
[ 64.0% - 64.5% ] 64.39% | 71,088 | 40.3% |
[ 65.0% - 65.5% ] 65.17% | 29,830 | 42.3% |
[ 66.5% - 67.0% ] 66.94% | 42,081 | 36.6% |