Immigrants from Cuba Wage/Income Gap
COMPARE
Immigrants from Cuba
Select to Compare
Wage/Income Gap
Immigrants from Cuba Wage/Income Gap
22.4%
WAGE/INCOME GAP
100.0/ 100
METRIC RATING
58th/ 347
METRIC RANK
Immigrants from Cuba Wage/Income Gap Correlation Chart
The statistical analysis conducted on geographies consisting of 325,829,876 people shows a slight negative correlation between the proportion of Immigrants from Cuba and wage/income gap percentage in the United States with a correlation coefficient (R) of -0.097 and weighted average of 22.4%. On average, for every 1% (one percent) increase in Immigrants from Cuba within a typical geography, there is a decrease of 0.046% in wage/income gap percentage.
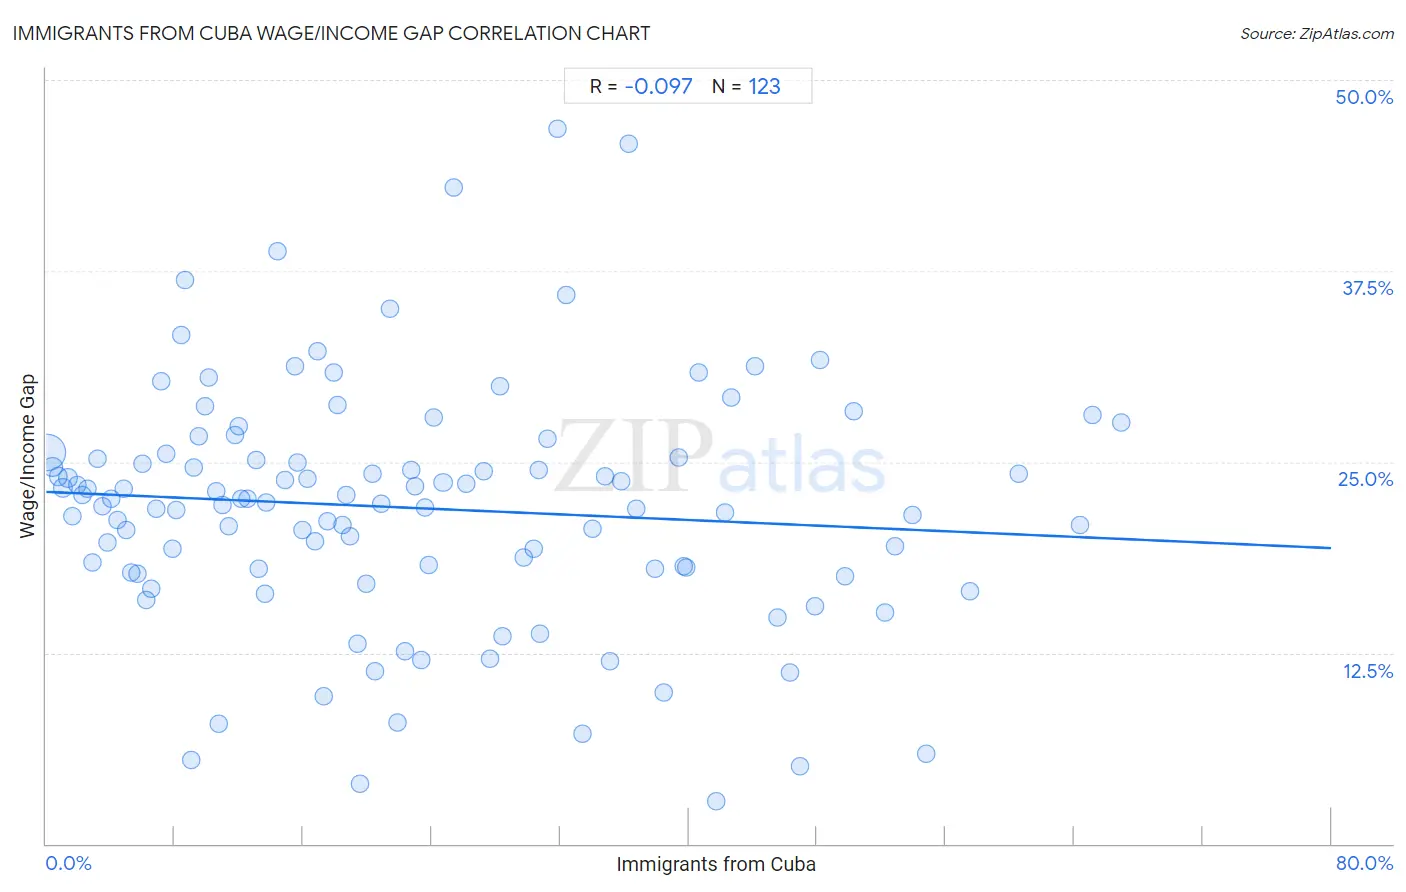
It is essential to understand that the correlation between the percentage of Immigrants from Cuba and wage/income gap percentage does not imply a direct cause-and-effect relationship. It remains uncertain whether the presence of Immigrants from Cuba influences an upward or downward trend in the level of wage/income gap percentage within an area, or if Immigrants from Cuba simply ended up residing in those areas with higher or lower levels of wage/income gap percentage due to other factors.
Demographics Similar to Immigrants from Cuba by Wage/Income Gap
In terms of wage/income gap, the demographic groups most similar to Immigrants from Cuba are Navajo (22.4%, a difference of 0.040%), Immigrants from Middle Africa (22.4%, a difference of 0.060%), Ghanaian (22.3%, a difference of 0.080%), Immigrants from Ghana (22.3%, a difference of 0.18%), and Immigrants from Zaire (22.3%, a difference of 0.22%).
| Demographics | Rating | Rank | Wage/Income Gap |
| Tohono O'odham | 100.0 /100 | #51 | Exceptional 22.1% |
| Immigrants from Cameroon | 100.0 /100 | #52 | Exceptional 22.2% |
| Bangladeshis | 100.0 /100 | #53 | Exceptional 22.2% |
| Nepalese | 100.0 /100 | #54 | Exceptional 22.2% |
| Immigrants from Zaire | 100.0 /100 | #55 | Exceptional 22.3% |
| Immigrants from Ghana | 100.0 /100 | #56 | Exceptional 22.3% |
| Ghanaians | 100.0 /100 | #57 | Exceptional 22.3% |
| Immigrants from Cuba | 100.0 /100 | #58 | Exceptional 22.4% |
| Navajo | 100.0 /100 | #59 | Exceptional 22.4% |
| Immigrants from Middle Africa | 100.0 /100 | #60 | Exceptional 22.4% |
| Immigrants from Fiji | 100.0 /100 | #61 | Exceptional 22.4% |
| Immigrants from Guatemala | 100.0 /100 | #62 | Exceptional 22.5% |
| Immigrants from Ecuador | 100.0 /100 | #63 | Exceptional 22.5% |
| Spanish American Indians | 100.0 /100 | #64 | Exceptional 22.5% |
| Guatemalans | 99.9 /100 | #65 | Exceptional 22.6% |
Immigrants from Cuba Wage/Income Gap Correlation Summary
| Measurement | Immigrants from Cuba Data | Wage/Income Gap Data |
| Minimum | 0.095% | 2.8% |
| Maximum | 66.9% | 46.8% |
| Range | 66.8% | 44.0% |
| Mean | 22.9% | 22.0% |
| Median | 19.4% | 22.3% |
| Interquartile 25% (IQ1) | 9.2% | 18.0% |
| Interquartile 75% (IQ3) | 34.8% | 25.3% |
| Interquartile Range (IQR) | 25.6% | 7.3% |
| Standard Deviation (Sample) | 16.7% | 7.9% |
| Standard Deviation (Population) | 16.6% | 7.9% |
Correlation Details
| Immigrants from Cuba Percentile | Sample Size | Wage/Income Gap |
[ 0.0% - 0.5% ] 0.095% | 252,909,779 | 25.6% |
[ 0.0% - 0.5% ] 0.43% | 30,383,147 | 24.7% |
[ 0.5% - 1.0% ] 0.74% | 11,799,774 | 24.0% |
[ 1.0% - 1.5% ] 1.04% | 6,679,711 | 23.3% |
[ 1.0% - 1.5% ] 1.35% | 4,298,458 | 23.9% |
[ 1.5% - 2.0% ] 1.66% | 2,696,342 | 21.4% |
[ 1.5% - 2.0% ] 1.96% | 2,719,597 | 23.5% |
[ 2.0% - 2.5% ] 2.29% | 1,237,021 | 22.9% |
[ 2.5% - 3.0% ] 2.57% | 787,398 | 23.3% |
[ 2.5% - 3.0% ] 2.88% | 1,015,501 | 18.4% |
[ 3.0% - 3.5% ] 3.19% | 651,502 | 25.2% |
[ 3.0% - 3.5% ] 3.50% | 588,803 | 22.1% |
[ 3.5% - 4.0% ] 3.78% | 657,122 | 19.7% |
[ 4.0% - 4.5% ] 4.05% | 272,162 | 22.6% |
[ 4.0% - 4.5% ] 4.47% | 199,844 | 21.2% |
[ 4.5% - 5.0% ] 4.79% | 661,933 | 23.2% |
[ 5.0% - 5.5% ] 5.01% | 362,351 | 20.5% |
[ 5.0% - 5.5% ] 5.29% | 355,191 | 17.7% |
[ 5.5% - 6.0% ] 5.66% | 401,062 | 17.7% |
[ 5.5% - 6.0% ] 5.96% | 245,235 | 24.9% |
[ 6.0% - 6.5% ] 6.19% | 324,166 | 16.0% |
[ 6.5% - 7.0% ] 6.54% | 179,865 | 16.7% |
[ 6.5% - 7.0% ] 6.81% | 395,982 | 22.0% |
[ 7.0% - 7.5% ] 7.16% | 51,934 | 30.3% |
[ 7.0% - 7.5% ] 7.47% | 214,149 | 25.5% |
[ 7.5% - 8.0% ] 7.82% | 286,833 | 19.3% |
[ 8.0% - 8.5% ] 8.06% | 118,840 | 21.9% |
[ 8.0% - 8.5% ] 8.39% | 7,589 | 33.3% |
[ 8.5% - 9.0% ] 8.62% | 38,542 | 36.9% |
[ 9.0% - 9.5% ] 9.05% | 23,774 | 5.5% |
[ 9.0% - 9.5% ] 9.15% | 48,353 | 24.7% |
[ 9.5% - 10.0% ] 9.52% | 119,826 | 26.7% |
[ 9.5% - 10.0% ] 9.90% | 76,717 | 28.6% |
[ 10.0% - 10.5% ] 10.08% | 69,663 | 30.5% |
[ 10.5% - 11.0% ] 10.56% | 181,514 | 23.1% |
[ 10.5% - 11.0% ] 10.71% | 80,262 | 7.8% |
[ 11.0% - 11.5% ] 11.01% | 57,923 | 22.2% |
[ 11.0% - 11.5% ] 11.37% | 114,298 | 20.7% |
[ 11.5% - 12.0% ] 11.72% | 26,094 | 26.8% |
[ 11.5% - 12.0% ] 11.97% | 107,253 | 27.4% |
[ 12.0% - 12.5% ] 12.18% | 38,774 | 22.6% |
[ 12.5% - 13.0% ] 12.54% | 63,572 | 22.6% |
[ 13.0% - 13.5% ] 13.05% | 15,218 | 25.1% |
[ 13.0% - 13.5% ] 13.23% | 149,277 | 18.0% |
[ 13.5% - 14.0% ] 13.59% | 35,710 | 16.4% |
[ 13.5% - 14.0% ] 13.71% | 34,336 | 22.3% |
[ 14.0% - 14.5% ] 14.38% | 62,961 | 38.8% |
[ 14.5% - 15.0% ] 14.90% | 10,520 | 23.8% |
[ 15.0% - 15.5% ] 15.46% | 82,400 | 31.3% |
[ 15.5% - 16.0% ] 15.63% | 117,398 | 24.9% |
[ 15.5% - 16.0% ] 15.97% | 24,257 | 20.5% |
[ 16.0% - 16.5% ] 16.25% | 106,757 | 23.9% |
[ 16.5% - 17.0% ] 16.71% | 10,992 | 19.8% |
[ 16.5% - 17.0% ] 16.88% | 10,597 | 32.3% |
[ 17.0% - 17.5% ] 17.25% | 47,065 | 9.7% |
[ 17.5% - 18.0% ] 17.50% | 18,719 | 21.1% |
[ 17.5% - 18.0% ] 17.88% | 59,121 | 30.9% |
[ 18.0% - 18.5% ] 18.13% | 26,717 | 28.7% |
[ 18.0% - 18.5% ] 18.42% | 170,587 | 20.9% |
[ 18.5% - 19.0% ] 18.65% | 115,926 | 22.8% |
[ 18.5% - 19.0% ] 18.93% | 48,849 | 20.2% |
[ 19.0% - 19.5% ] 19.36% | 100,913 | 13.1% |
[ 19.5% - 20.0% ] 19.54% | 11,943 | 3.9% |
[ 19.5% - 20.0% ] 19.95% | 143,303 | 17.1% |
[ 20.0% - 20.5% ] 20.29% | 85,659 | 24.2% |
[ 20.0% - 20.5% ] 20.48% | 581 | 11.3% |
[ 20.5% - 21.0% ] 20.82% | 52,197 | 22.3% |
[ 21.0% - 21.5% ] 21.43% | 32,946 | 35.0% |
[ 21.5% - 22.0% ] 21.84% | 16,776 | 8.0% |
[ 22.0% - 22.5% ] 22.36% | 8,617 | 12.6% |
[ 22.5% - 23.0% ] 22.72% | 27,033 | 24.4% |
[ 22.5% - 23.0% ] 22.97% | 24,179 | 23.4% |
[ 23.0% - 23.5% ] 23.35% | 26,364 | 12.1% |
[ 23.5% - 24.0% ] 23.59% | 84,418 | 22.0% |
[ 23.5% - 24.0% ] 23.82% | 15,182 | 18.2% |
[ 24.0% - 24.5% ] 24.15% | 57,327 | 27.9% |
[ 24.5% - 25.0% ] 24.71% | 463,011 | 23.7% |
[ 25.0% - 25.5% ] 25.34% | 8,989 | 43.0% |
[ 26.0% - 26.5% ] 26.13% | 2,419 | 23.6% |
[ 27.0% - 27.5% ] 27.25% | 73,954 | 24.4% |
[ 27.5% - 28.0% ] 27.62% | 36,964 | 12.1% |
[ 28.0% - 28.5% ] 28.25% | 37,958 | 29.9% |
[ 28.0% - 28.5% ] 28.43% | 60,573 | 13.6% |
[ 29.5% - 30.0% ] 29.74% | 68,517 | 18.7% |
[ 30.0% - 30.5% ] 30.32% | 80,505 | 19.4% |
[ 30.5% - 31.0% ] 30.65% | 40,718 | 24.4% |
[ 30.5% - 31.0% ] 30.73% | 86,031 | 13.8% |
[ 31.0% - 31.5% ] 31.17% | 40,278 | 26.5% |
[ 31.5% - 32.0% ] 31.79% | 5,303 | 46.8% |
[ 32.0% - 32.5% ] 32.40% | 2,318 | 35.9% |
[ 33.0% - 33.5% ] 33.42% | 30,621 | 7.2% |
[ 34.0% - 34.5% ] 34.03% | 35,705 | 20.6% |
[ 34.5% - 35.0% ] 34.79% | 57,066 | 24.0% |
[ 35.0% - 35.5% ] 35.07% | 60,279 | 11.9% |
[ 35.5% - 36.0% ] 35.78% | 37,977 | 23.7% |
[ 36.0% - 36.5% ] 36.29% | 3,400 | 45.8% |
[ 36.5% - 37.0% ] 36.74% | 54,873 | 22.0% |
[ 37.5% - 38.0% ] 37.92% | 7,623 | 18.0% |
[ 38.0% - 38.5% ] 38.43% | 43,702 | 9.9% |
[ 39.0% - 39.5% ] 39.35% | 34,057 | 25.3% |
[ 39.5% - 40.0% ] 39.68% | 34,742 | 18.2% |
[ 39.5% - 40.0% ] 39.87% | 49,483 | 18.1% |
[ 40.5% - 41.0% ] 40.65% | 34,335 | 30.8% |
[ 41.5% - 42.0% ] 41.73% | 13,824 | 2.8% |
[ 42.0% - 42.5% ] 42.27% | 52,661 | 21.7% |
[ 42.5% - 43.0% ] 42.62% | 19,399 | 29.2% |
[ 44.0% - 44.5% ] 44.13% | 55,241 | 31.3% |
[ 45.5% - 46.0% ] 45.55% | 24,597 | 14.8% |
[ 46.0% - 46.5% ] 46.31% | 40,739 | 11.2% |
[ 46.5% - 47.0% ] 46.90% | 10,725 | 5.1% |
[ 47.5% - 48.0% ] 47.86% | 52,851 | 15.6% |
[ 48.0% - 48.5% ] 48.15% | 53,765 | 31.6% |
[ 49.5% - 50.0% ] 49.72% | 50,233 | 17.5% |
[ 50.0% - 50.5% ] 50.26% | 46,798 | 28.3% |
[ 52.0% - 52.5% ] 52.20% | 52,047 | 15.1% |
[ 52.5% - 53.0% ] 52.80% | 45,620 | 19.5% |
[ 53.5% - 54.0% ] 53.93% | 22,815 | 21.5% |
[ 54.5% - 55.0% ] 54.81% | 20,850 | 5.9% |
[ 57.5% - 58.0% ] 57.54% | 26,596 | 16.5% |
[ 60.5% - 61.0% ] 60.57% | 224,014 | 24.2% |
[ 64.0% - 64.5% ] 64.39% | 71,088 | 20.9% |
[ 65.0% - 65.5% ] 65.17% | 29,830 | 28.1% |
[ 66.5% - 67.0% ] 66.94% | 42,081 | 27.6% |