Immigrants from Bosnia and Herzegovina 2 or more Vehicles in Household
COMPARE
Immigrants from Bosnia and Herzegovina
Select to Compare
2 or more Vehicles in Household
Immigrants from Bosnia and Herzegovina 2 or more Vehicles in Household
53.8%
2+ VEHICLES AVAILABLE
5.5/ 100
METRIC RATING
223rd/ 347
METRIC RANK
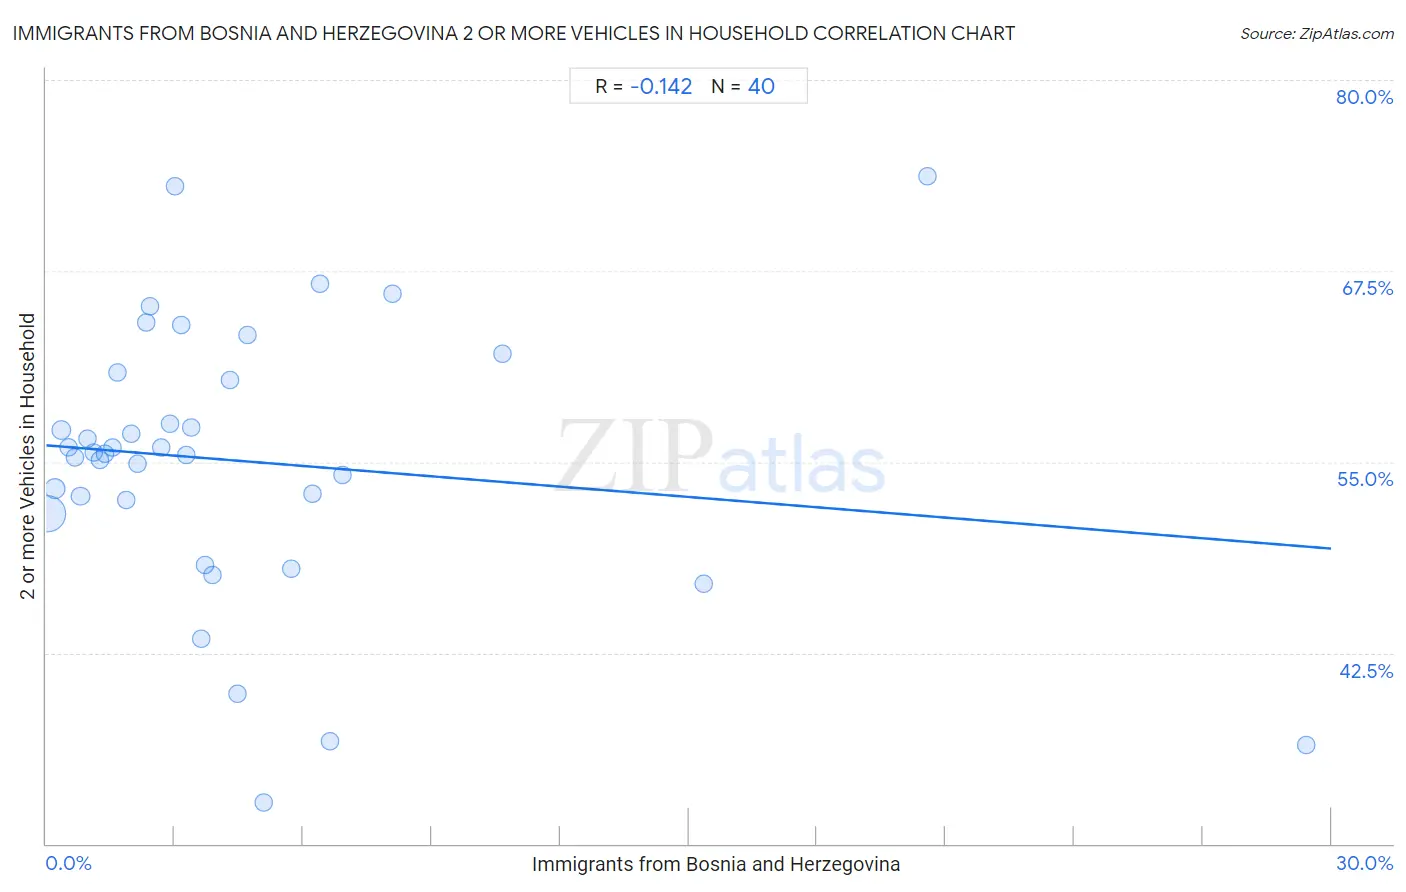
Immigrants from Bosnia and Herzegovina 2 or more Vehicles in Household Correlation Chart
The statistical analysis conducted on geographies consisting of 156,805,510 people shows a poor negative correlation between the proportion of Immigrants from Bosnia and Herzegovina and percentage of households with 2 or more vehicles available in the United States with a correlation coefficient (R) of -0.142 and weighted average of 53.8%. On average, for every 1% (one percent) increase in Immigrants from Bosnia and Herzegovina within a typical geography, there is a decrease of 0.23% in percentage of households with 2 or more vehicles available.
It is essential to understand that the correlation between the percentage of Immigrants from Bosnia and Herzegovina and percentage of households with 2 or more vehicles available does not imply a direct cause-and-effect relationship. It remains uncertain whether the presence of Immigrants from Bosnia and Herzegovina influences an upward or downward trend in the level of percentage of households with 2 or more vehicles available within an area, or if Immigrants from Bosnia and Herzegovina simply ended up residing in those areas with higher or lower levels of percentage of households with 2 or more vehicles available due to other factors.
Demographics Similar to Immigrants from Bosnia and Herzegovina by 2 or more Vehicles in Household
In terms of 2 or more vehicles in household, the demographic groups most similar to Immigrants from Bosnia and Herzegovina are Brazilian (53.8%, a difference of 0.040%), Immigrants from Egypt (53.8%, a difference of 0.050%), Immigrants from Eastern Africa (53.7%, a difference of 0.070%), Kiowa (53.9%, a difference of 0.13%), and Immigrants from Singapore (53.9%, a difference of 0.15%).
| Demographics | Rating | Rank | 2 or more Vehicles in Household |
| Immigrants from Western Asia | 9.3 /100 | #216 | Tragic 54.1% |
| Immigrants from Burma/Myanmar | 7.1 /100 | #217 | Tragic 53.9% |
| Immigrants from Argentina | 6.8 /100 | #218 | Tragic 53.9% |
| South American Indians | 6.5 /100 | #219 | Tragic 53.9% |
| Taiwanese | 6.3 /100 | #220 | Tragic 53.9% |
| Immigrants from Singapore | 6.3 /100 | #221 | Tragic 53.9% |
| Kiowa | 6.2 /100 | #222 | Tragic 53.9% |
| Immigrants from Bosnia and Herzegovina | 5.5 /100 | #223 | Tragic 53.8% |
| Brazilians | 5.3 /100 | #224 | Tragic 53.8% |
| Immigrants from Egypt | 5.2 /100 | #225 | Tragic 53.8% |
| Immigrants from Eastern Africa | 5.1 /100 | #226 | Tragic 53.7% |
| Sudanese | 4.1 /100 | #227 | Tragic 53.6% |
| Alaska Natives | 3.9 /100 | #228 | Tragic 53.6% |
| Immigrants from Turkey | 3.8 /100 | #229 | Tragic 53.6% |
| Immigrants from Nepal | 3.6 /100 | #230 | Tragic 53.5% |
Immigrants from Bosnia and Herzegovina 2 or more Vehicles in Household Correlation Summary
| Measurement | Immigrants from Bosnia and Herzegovina Data | 2 or more Vehicles in Household Data |
| Minimum | 0.041% | 32.7% |
| Maximum | 29.4% | 73.7% |
| Range | 29.4% | 41.0% |
| Mean | 4.6% | 55.0% |
| Median | 3.1% | 55.6% |
| Interquartile 25% (IQ1) | 1.5% | 52.1% |
| Interquartile 75% (IQ3) | 5.4% | 60.6% |
| Interquartile Range (IQR) | 3.9% | 8.5% |
| Standard Deviation (Sample) | 5.7% | 9.0% |
| Standard Deviation (Population) | 5.6% | 8.9% |
Correlation Details
| Immigrants from Bosnia and Herzegovina Percentile | Sample Size | 2 or more Vehicles in Household |
[ 0.0% - 0.5% ] 0.041% | 124,008,596 | 51.6% |
[ 0.0% - 0.5% ] 0.20% | 17,597,799 | 53.2% |
[ 0.0% - 0.5% ] 0.36% | 7,607,813 | 57.1% |
[ 0.5% - 1.0% ] 0.51% | 2,122,855 | 56.0% |
[ 0.5% - 1.0% ] 0.66% | 1,196,775 | 55.3% |
[ 0.5% - 1.0% ] 0.80% | 1,320,654 | 52.8% |
[ 0.5% - 1.0% ] 0.95% | 572,001 | 56.5% |
[ 1.0% - 1.5% ] 1.10% | 369,725 | 55.6% |
[ 1.0% - 1.5% ] 1.26% | 520,714 | 55.2% |
[ 1.0% - 1.5% ] 1.37% | 102,204 | 55.5% |
[ 1.5% - 2.0% ] 1.54% | 175,181 | 55.9% |
[ 1.5% - 2.0% ] 1.66% | 359,718 | 60.9% |
[ 1.5% - 2.0% ] 1.86% | 106,566 | 52.5% |
[ 1.5% - 2.0% ] 1.98% | 105,445 | 56.8% |
[ 2.0% - 2.5% ] 2.14% | 113,789 | 54.9% |
[ 2.0% - 2.5% ] 2.34% | 72,733 | 64.2% |
[ 2.0% - 2.5% ] 2.43% | 47,303 | 65.2% |
[ 2.5% - 3.0% ] 2.70% | 816 | 55.9% |
[ 2.5% - 3.0% ] 2.88% | 22,992 | 57.5% |
[ 3.0% - 3.5% ] 3.01% | 532 | 73.1% |
[ 3.0% - 3.5% ] 3.16% | 12,587 | 64.0% |
[ 3.0% - 3.5% ] 3.26% | 11,619 | 55.5% |
[ 3.0% - 3.5% ] 3.38% | 50,347 | 57.2% |
[ 3.5% - 4.0% ] 3.62% | 48,317 | 43.4% |
[ 3.5% - 4.0% ] 3.70% | 7,051 | 48.2% |
[ 3.5% - 4.0% ] 3.89% | 24,014 | 47.6% |
[ 4.0% - 4.5% ] 4.28% | 19,922 | 60.4% |
[ 4.0% - 4.5% ] 4.45% | 69,823 | 39.8% |
[ 4.5% - 5.0% ] 4.68% | 2,220 | 63.3% |
[ 5.0% - 5.5% ] 5.09% | 5,345 | 32.7% |
[ 5.5% - 6.0% ] 5.71% | 8,759 | 48.0% |
[ 6.0% - 6.5% ] 6.23% | 45,300 | 53.0% |
[ 6.0% - 6.5% ] 6.38% | 47 | 66.7% |
[ 6.5% - 7.0% ] 6.62% | 40,152 | 36.7% |
[ 6.5% - 7.0% ] 6.90% | 32,750 | 54.1% |
[ 8.0% - 8.5% ] 8.09% | 136 | 66.0% |
[ 10.5% - 11.0% ] 10.65% | 695 | 62.1% |
[ 15.0% - 15.5% ] 15.36% | 1,875 | 47.0% |
[ 20.5% - 21.0% ] 20.59% | 102 | 73.7% |
[ 29.0% - 29.5% ] 29.41% | 238 | 36.5% |