Immigrants from Bosnia and Herzegovina 4 or more Vehicles in Household

COMPARE

Immigrants from Bosnia and Herzegovina
Race
Ancestry
AfghanAfricanAlaska NativeAlaskan AthabascanAlbanianAleutAlsatianAmericanApacheArabArapahoArgentineanArmenianAssyrian/Chaldean/SyriacAustralianAustrianBahamianBangladeshiBarbadianBasqueBelgianBelizeanBermudanBhutaneseBlackfeetBolivianBrazilianBritishBritish West IndianBulgarianBurmeseCajunCambodianCanadianCape VerdeanCarpatho RusynCelticCentral AmericanCentral American IndianCherokeeCheyenneChickasawChileanChineseChippewaChoctawColombianColvilleComancheCosta RicanCreeCreekCroatianCrowCubanCypriotCzechCzechoslovakianDanishDelawareDominicanDutchDutch West IndianEastern EuropeanEcuadorianEgyptianEnglishEstonianEthiopianEuropeanFijianFilipinoFinnishFrenchFrench American IndianFrench CanadianGermanGerman RussianGhanaianGreekGuamanian/ChamorroGuatemalanGuyaneseHaitianHmongHonduranHopiHoumaHungarianIcelanderIndian (Asian)IndonesianInupiatIranianIraqiIrishIroquoisIsraeliItalianJamaicanJapaneseJordanianKenyanKiowaKoreanLaotianLatvianLebaneseLiberianLithuanianLumbeeLuxembourgerMacedonianMalaysianMalteseMarshalleseMenomineeMexicanMexican American IndianMongolianMoroccanNative HawaiianNavajoNepaleseNew ZealanderNicaraguanNigerianNorthern EuropeanNorwegianOkinawanOsageOttawaPaiutePakistaniPalestinianPanamanianParaguayanPennsylvania GermanPeruvianPimaPolishPortuguesePotawatomiPuebloPuerto RicanPuget Sound SalishRomanianRussianSalvadoranSamoanScandinavianScotch-IrishScottishSeminoleSenegaleseSerbianShoshoneSierra LeoneanSiouxSlavicSlovakSloveneSomaliSouth AfricanSouth AmericanSouth American IndianSoviet UnionSpaniardSpanishSpanish AmericanSpanish American IndianSri LankanSubsaharan AfricanSudaneseSwedishSwissSyrianTaiwaneseThaiTlingit-HaidaTohono O'OdhamTonganTrinidadian and TobagonianTsimshianTurkishU.S. Virgin IslanderUgandanUkrainianUruguayanUteVenezuelanVietnameseWelshWest IndianYakamaYaquiYugoslavianYumanYup'ikZimbabwean
Immigration
NonimmigrantsImmigrantsAfghanistanAfricaAlbaniaArgentinaArmeniaAsiaAustraliaAustriaBahamasBangladeshBarbadosBelarusBelgiumBelizeBoliviaBosnia and HerzegovinaBrazilBulgariaBurma/MyanmarCabo VerdeCambodiaCameroonCanadaCaribbeanCentral AmericaChileChinaColombiaCongoCosta RicaCroatiaCubaCzechoslovakiaDenmarkDominicaDominican RepublicEastern AfricaEastern AsiaEastern EuropeEcuadorEgyptEl SalvadorEnglandEritreaEthiopiaEuropeFijiFranceGermanyGhanaGreeceGrenadaGuatemalaGuyanaHaitiHondurasHong KongHungaryIndiaIndonesiaIranIraqIrelandIsraelItalyJamaicaJapanJordanKazakhstanKenyaKoreaKuwaitLaosLatin AmericaLatviaLebanonLiberiaLithuaniaMalaysiaMexicoMicronesiaMiddle AfricaMoldovaMoroccoNepalNetherlandsNicaraguaNigeriaNorth AmericaNorth MacedoniaNorthern AfricaNorthern EuropeNorwayOceaniaPakistanPanamaPeruPhilippinesPolandPortugalRomaniaRussiaSaudi ArabiaScotlandSenegalSerbiaSierra LeoneSingaporeSomaliaSouth AfricaSouth AmericaSouth Central AsiaSouth Eastern AsiaSouthern EuropeSpainSri LankaSt. Vincent and the GrenadinesSudanSwedenSwitzerlandSyriaTaiwanThailandTrinidad and TobagoTurkeyUgandaUkraineUruguayUzbekistanVenezuelaVietnamWest IndiesWestern AfricaWestern AsiaWestern EuropeYemenZaireZimbabweAzores
Select to Compare
Race
Ancestry
AfghanAfricanAlaska NativeAlaskan AthabascanAlbanianAleutAlsatianAmericanApacheArabArapahoArgentineanArmenianAssyrian/Chaldean/SyriacAustralianAustrianBahamianBangladeshiBarbadianBasqueBelgianBelizeanBermudanBhutaneseBlackfeetBolivianBrazilianBritishBritish West IndianBulgarianBurmeseCajunCambodianCanadianCape VerdeanCarpatho RusynCelticCentral AmericanCentral American IndianCherokeeCheyenneChickasawChileanChineseChippewaChoctawColombianColvilleComancheCosta RicanCreeCreekCroatianCrowCubanCypriotCzechCzechoslovakianDanishDelawareDominicanDutchDutch West IndianEastern EuropeanEcuadorianEgyptianEnglishEstonianEthiopianEuropeanFijianFilipinoFinnishFrenchFrench American IndianFrench CanadianGermanGerman RussianGhanaianGreekGuamanian/ChamorroGuatemalanGuyaneseHaitianHmongHonduranHopiHoumaHungarianIcelanderIndian (Asian)IndonesianInupiatIranianIraqiIrishIroquoisIsraeliItalianJamaicanJapaneseJordanianKenyanKiowaKoreanLaotianLatvianLebaneseLiberianLithuanianLumbeeLuxembourgerMacedonianMalaysianMalteseMarshalleseMenomineeMexicanMexican American IndianMongolianMoroccanNative HawaiianNavajoNepaleseNew ZealanderNicaraguanNigerianNorthern EuropeanNorwegianOkinawanOsageOttawaPaiutePakistaniPalestinianPanamanianParaguayanPennsylvania GermanPeruvianPimaPolishPortuguesePotawatomiPuebloPuerto RicanPuget Sound SalishRomanianRussianSalvadoranSamoanScandinavianScotch-IrishScottishSeminoleSenegaleseSerbianShoshoneSierra LeoneanSiouxSlavicSlovakSloveneSomaliSouth AfricanSouth AmericanSouth American IndianSoviet UnionSpaniardSpanishSpanish AmericanSpanish American IndianSri LankanSubsaharan AfricanSudaneseSwedishSwissSyrianTaiwaneseThaiTlingit-HaidaTohono O'OdhamTonganTrinidadian and TobagonianTsimshianTurkishU.S. Virgin IslanderUgandanUkrainianUruguayanUteVenezuelanVietnameseWelshWest IndianYakamaYaquiYugoslavianYumanYup'ikZimbabwean
Immigration
NonimmigrantsImmigrantsAfghanistanAfricaAlbaniaArgentinaArmeniaAsiaAustraliaAustriaBahamasBangladeshBarbadosBelarusBelgiumBelizeBoliviaBrazilBulgariaBurma/MyanmarCabo VerdeCambodiaCameroonCanadaCaribbeanCentral AmericaChileChinaColombiaCongoCosta RicaCroatiaCubaCzechoslovakiaDenmarkDominicaDominican RepublicEastern AfricaEastern AsiaEastern EuropeEcuadorEgyptEl SalvadorEnglandEritreaEthiopiaEuropeFijiFranceGermanyGhanaGreeceGrenadaGuatemalaGuyanaHaitiHondurasHong KongHungaryIndiaIndonesiaIranIraqIrelandIsraelItalyJamaicaJapanJordanKazakhstanKenyaKoreaKuwaitLaosLatin AmericaLatviaLebanonLiberiaLithuaniaMalaysiaMexicoMicronesiaMiddle AfricaMoldovaMoroccoNepalNetherlandsNicaraguaNigeriaNorth AmericaNorth MacedoniaNorthern AfricaNorthern EuropeNorwayOceaniaPakistanPanamaPeruPhilippinesPolandPortugalRomaniaRussiaSaudi ArabiaScotlandSenegalSerbiaSierra LeoneSingaporeSomaliaSouth AfricaSouth AmericaSouth Central AsiaSouth Eastern AsiaSouthern EuropeSpainSri LankaSt. Vincent and the GrenadinesSudanSwedenSwitzerlandSyriaTaiwanThailandTrinidad and TobagoTurkeyUgandaUkraineUruguayUzbekistanVenezuelaVietnamWest IndiesWestern AfricaWestern AsiaWestern EuropeYemenZaireZimbabweAzores
4 or more Vehicles in Household
Income
Poverty
Unemployment
Labor Participation
Family Structure
Vehicle Availability
Education Level
Disability

Immigrants from Bosnia and Herzegovina 4 or more Vehicles in Household
Tragic

5.3%
4+ VEHICLES AVAILABLE
0.2/ 100
METRIC RATING
289th/ 347
METRIC RANK

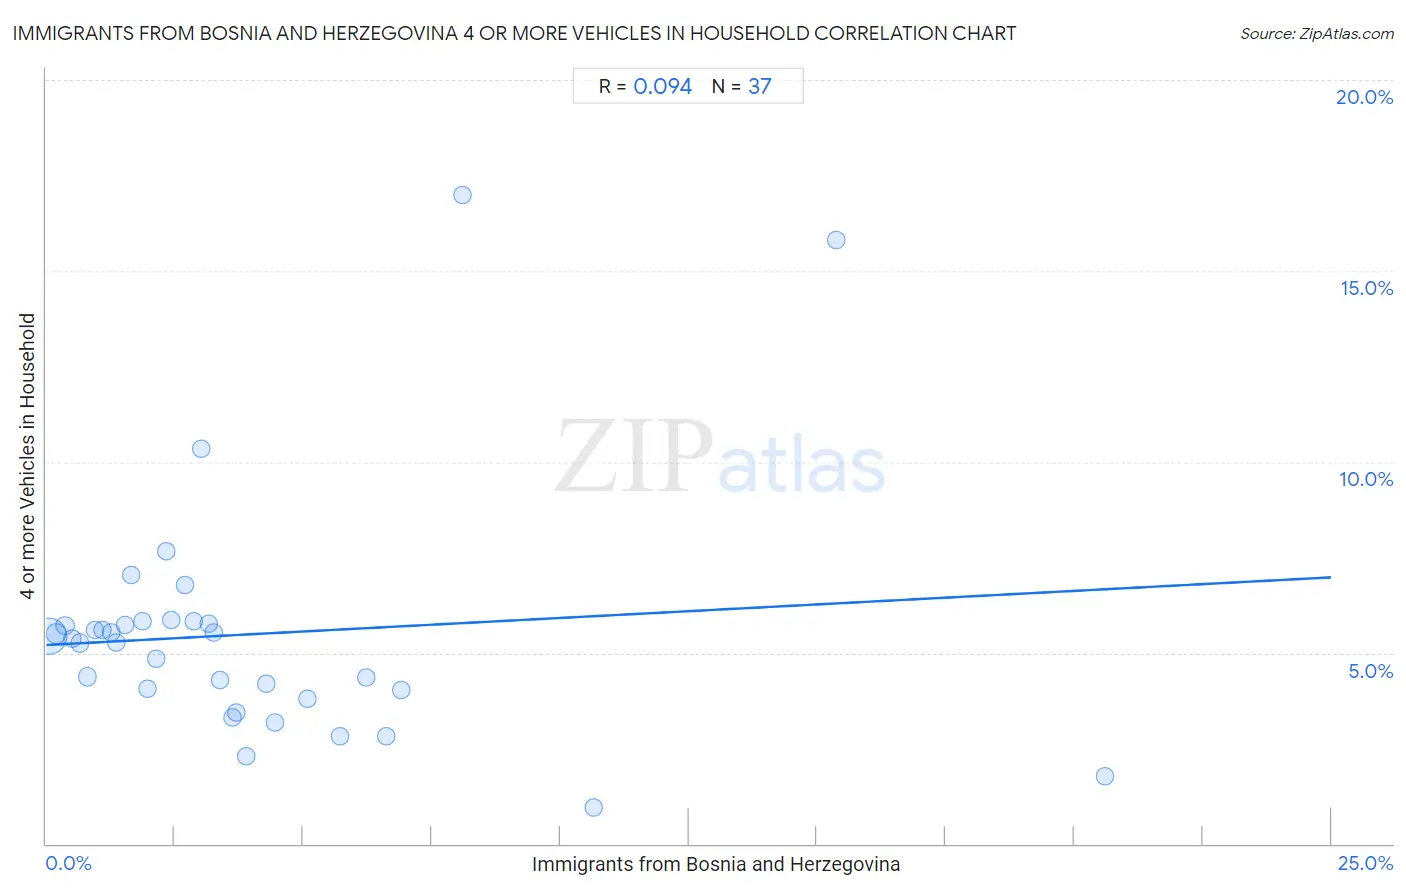
Immigrants from Bosnia and Herzegovina 4 or more Vehicles in Household Correlation Chart

The statistical analysis conducted on geographies consisting of 156,484,341 people shows a slight positive correlation between the proportion of Immigrants from Bosnia and Herzegovina and percentage of households with 4 or more vehicles available in the United States with a correlation coefficient (R) of 0.094 and weighted average of 5.3%. On average, for every 1% (one percent) increase in Immigrants from Bosnia and Herzegovina within a typical geography, there is an increase of 0.071% in percentage of households with 4 or more vehicles available.
Immigrants from Bosnia and Herzegovina 4 or more Vehicles in Household
It is essential to understand that the correlation between the percentage of Immigrants from Bosnia and Herzegovina and percentage of households with 4 or more vehicles available does not imply a direct cause-and-effect relationship. It remains uncertain whether the presence of Immigrants from Bosnia and Herzegovina influences an upward or downward trend in the level of percentage of households with 4 or more vehicles available within an area, or if Immigrants from Bosnia and Herzegovina simply ended up residing in those areas with higher or lower levels of percentage of households with 4 or more vehicles available due to other factors.

Demographics Similar to Immigrants from Bosnia and Herzegovina by 4 or more Vehicles in Household

In terms of 4 or more vehicles in household, the demographic groups most similar to Immigrants from Bosnia and Herzegovina are Venezuelan (5.3%, a difference of 0.14%), Immigrants from Russia (5.3%, a difference of 0.30%), Immigrants from Croatia (5.4%, a difference of 0.33%), Immigrants from Colombia (5.4%, a difference of 0.42%), and Immigrants from Liberia (5.4%, a difference of 0.46%).
DemographicsRating | Rank4 or more Vehicles in Household
Immigrants from Spain
0.3
/100
|
#282
Tragic
5.4%
Immigrants from Ireland
0.3
/100
|
#283
Tragic
5.4%
Brazilians
0.3
/100
|
#284
Tragic
5.4%
Immigrants from Liberia
0.2
/100
|
#285
Tragic
5.4%
Immigrants from Colombia
0.2
/100
|
#286
Tragic
5.4%
Immigrants from Croatia
0.2
/100
|
#287
Tragic
5.4%
Venezuelans
0.2
/100
|
#288
Tragic
5.3%
Immigrants from Bosnia and Herzegovina
0.2
/100
|
#289
Tragic
5.3%
Immigrants from Russia
0.2
/100
|
#290
Tragic
5.3%
Immigrants from Bahamas
0.1
/100
|
#291
Tragic
5.3%
Liberians
0.1
/100
|
#292
Tragic
5.3%
Immigrants from Congo
0.1
/100
|
#293
Tragic
5.2%
Ghanaians
0.1
/100
|
#294
Tragic
5.2%
Immigrants from Brazil
0.1
/100
|
#295
Tragic
5.2%
Israelis
0.1
/100
|
#296
Tragic
5.2%

Immigrants from Bosnia and Herzegovina 4 or more Vehicles in Household Correlation Summary

MeasurementImmigrants from Bosnia and Herzegovina Data4 or more Vehicles in Household Data
Minimum0.040%0.96%
Maximum20.6%17.0%
Range20.5%16.0%
Mean3.9%5.5%
Median2.9%5.4%
Interquartile 25% (IQ1)1.3%3.9%
Interquartile 75% (IQ3)4.8%5.8%
Interquartile Range (IQR)3.5%1.9%
Standard Deviation (Sample)4.2%3.2%
Standard Deviation (Population)4.1%3.1%

Correlation Details

Immigrants from Bosnia and Herzegovina PercentileSample Size4 or more Vehicles in Household
[
0.0%
-
0.5%
]
0.040%
123,784,3485.4%
[
0.0%
-
0.5%
]
0.20%
17,545,0275.5%
[
0.0%
-
0.5%
]
0.36%
7,592,4895.7%
[
0.5%
-
1.0%
]
0.51%
2,120,7995.4%
[
0.5%
-
1.0%
]
0.66%
1,196,7755.3%
[
0.5%
-
1.0%
]
0.80%
1,308,8084.4%
[
0.5%
-
1.0%
]
0.95%
569,9445.6%
[
1.0%
-
1.5%
]
1.10%
362,9655.6%
[
1.0%
-
1.5%
]
1.26%
520,7145.5%
[
1.0%
-
1.5%
]
1.37%
102,2045.3%
[
1.5%
-
2.0%
]
1.54%
175,1815.7%
[
1.5%
-
2.0%
]
1.66%
356,4907.0%
[
1.5%
-
2.0%
]
1.86%
106,5665.8%
[
1.5%
-
2.0%
]
1.98%
105,4454.0%
[
2.0%
-
2.5%
]
2.14%
113,7894.9%
[
2.0%
-
2.5%
]
2.34%
72,7337.6%
[
2.0%
-
2.5%
]
2.43%
47,3035.9%
[
2.5%
-
3.0%
]
2.71%
4436.8%
[
2.5%
-
3.0%
]
2.88%
22,9925.8%
[
3.0%
-
3.5%
]
3.01%
53210.3%
[
3.0%
-
3.5%
]
3.16%
12,5875.7%
[
3.0%
-
3.5%
]
3.26%
11,6195.5%
[
3.0%
-
3.5%
]
3.38%
50,3474.3%
[
3.5%
-
4.0%
]
3.62%
48,3173.3%
[
3.5%
-
4.0%
]
3.70%
7,0513.4%
[
3.5%
-
4.0%
]
3.89%
24,0142.3%
[
4.0%
-
4.5%
]
4.28%
19,9224.2%
[
4.0%
-
4.5%
]
4.45%
69,8233.2%
[
5.0%
-
5.5%
]
5.09%
5,3453.8%
[
5.5%
-
6.0%
]
5.71%
8,7592.8%
[
6.0%
-
6.5%
]
6.23%
45,3004.3%
[
6.5%
-
7.0%
]
6.62%
40,1522.8%
[
6.5%
-
7.0%
]
6.90%
32,7504.0%
[
8.0%
-
8.5%
]
8.09%
13617.0%
[
10.5%
-
11.0%
]
10.65%
6950.96%
[
15.0%
-
15.5%
]
15.36%
1,87515.8%
[
20.5%
-
21.0%
]
20.59%
1021.8%