Immigrants from Belgium 4 or more Vehicles in Household
COMPARE
Immigrants from Belgium
Select to Compare
4 or more Vehicles in Household
Immigrants from Belgium 4 or more Vehicles in Household
5.8%
4+ VEHICLES AVAILABLE
4.0/ 100
METRIC RATING
238th/ 347
METRIC RANK
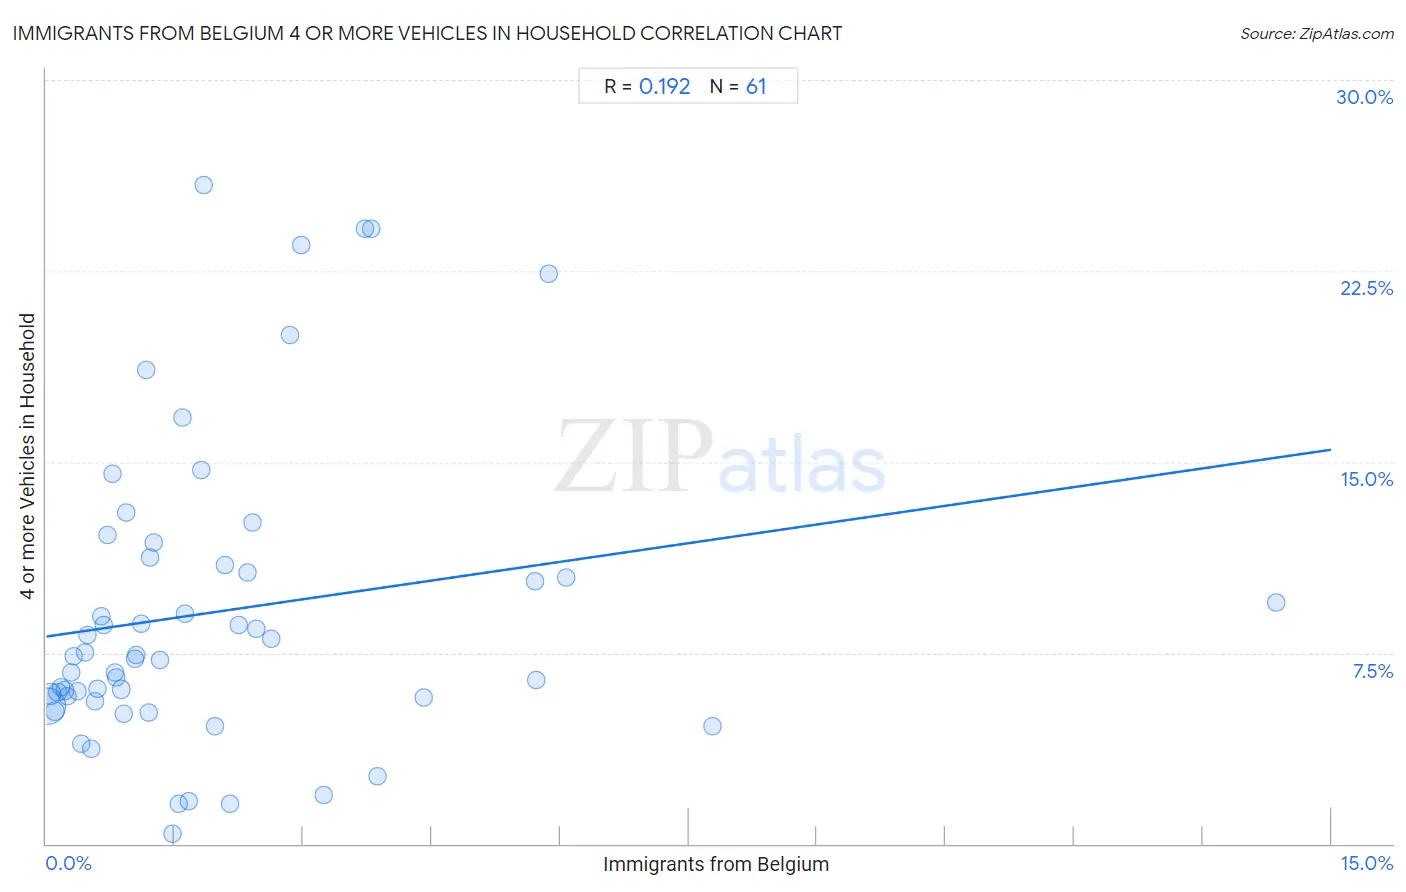
Immigrants from Belgium 4 or more Vehicles in Household Correlation Chart
The statistical analysis conducted on geographies consisting of 145,987,799 people shows a poor positive correlation between the proportion of Immigrants from Belgium and percentage of households with 4 or more vehicles available in the United States with a correlation coefficient (R) of 0.192 and weighted average of 5.8%. On average, for every 1% (one percent) increase in Immigrants from Belgium within a typical geography, there is an increase of 0.49% in percentage of households with 4 or more vehicles available.
It is essential to understand that the correlation between the percentage of Immigrants from Belgium and percentage of households with 4 or more vehicles available does not imply a direct cause-and-effect relationship. It remains uncertain whether the presence of Immigrants from Belgium influences an upward or downward trend in the level of percentage of households with 4 or more vehicles available within an area, or if Immigrants from Belgium simply ended up residing in those areas with higher or lower levels of percentage of households with 4 or more vehicles available due to other factors.
Demographics Similar to Immigrants from Belgium by 4 or more Vehicles in Household
In terms of 4 or more vehicles in household, the demographic groups most similar to Immigrants from Belgium are Immigrants from Australia (5.8%, a difference of 0.090%), Turkish (5.8%, a difference of 0.13%), Immigrants from Poland (5.8%, a difference of 0.13%), Mongolian (5.8%, a difference of 0.23%), and Immigrants from Eritrea (5.8%, a difference of 0.40%).
| Demographics | Rating | Rank | 4 or more Vehicles in Household |
| Immigrants from Switzerland | 6.4 /100 | #231 | Tragic 5.9% |
| Immigrants from Argentina | 6.0 /100 | #232 | Tragic 5.9% |
| Sierra Leoneans | 6.0 /100 | #233 | Tragic 5.9% |
| Africans | 4.6 /100 | #234 | Tragic 5.8% |
| Immigrants from Hungary | 4.6 /100 | #235 | Tragic 5.8% |
| Immigrants from Eritrea | 4.5 /100 | #236 | Tragic 5.8% |
| Turks | 4.1 /100 | #237 | Tragic 5.8% |
| Immigrants from Belgium | 4.0 /100 | #238 | Tragic 5.8% |
| Immigrants from Australia | 3.8 /100 | #239 | Tragic 5.8% |
| Immigrants from Poland | 3.8 /100 | #240 | Tragic 5.8% |
| Mongolians | 3.7 /100 | #241 | Tragic 5.8% |
| Immigrants from Middle Africa | 3.4 /100 | #242 | Tragic 5.8% |
| Immigrants from Czechoslovakia | 3.2 /100 | #243 | Tragic 5.8% |
| Ethiopians | 3.2 /100 | #244 | Tragic 5.8% |
| Bulgarians | 3.1 /100 | #245 | Tragic 5.8% |
Immigrants from Belgium 4 or more Vehicles in Household Correlation Summary
| Measurement | Immigrants from Belgium Data | 4 or more Vehicles in Household Data |
| Minimum | 0.016% | 0.41% |
| Maximum | 14.4% | 25.9% |
| Range | 14.3% | 25.5% |
| Mean | 2.0% | 9.1% |
| Median | 1.2% | 7.4% |
| Interquartile 25% (IQ1) | 0.58% | 5.7% |
| Interquartile 75% (IQ3) | 2.4% | 11.1% |
| Interquartile Range (IQR) | 1.8% | 5.4% |
| Standard Deviation (Sample) | 2.3% | 6.0% |
| Standard Deviation (Population) | 2.3% | 5.9% |
Correlation Details
| Immigrants from Belgium Percentile | Sample Size | 4 or more Vehicles in Household |
[ 0.0% - 0.5% ] 0.016% | 108,348,598 | 5.4% |
[ 0.0% - 0.5% ] 0.055% | 19,674,687 | 5.9% |
[ 0.0% - 0.5% ] 0.096% | 7,694,045 | 5.2% |
[ 0.0% - 0.5% ] 0.13% | 3,539,519 | 6.0% |
[ 0.0% - 0.5% ] 0.17% | 2,551,863 | 6.2% |
[ 0.0% - 0.5% ] 0.21% | 1,117,063 | 6.0% |
[ 0.0% - 0.5% ] 0.25% | 660,263 | 5.8% |
[ 0.0% - 0.5% ] 0.29% | 623,835 | 6.7% |
[ 0.0% - 0.5% ] 0.33% | 368,014 | 7.4% |
[ 0.0% - 0.5% ] 0.37% | 220,556 | 6.0% |
[ 0.0% - 0.5% ] 0.40% | 267,374 | 3.9% |
[ 0.0% - 0.5% ] 0.45% | 152,744 | 7.5% |
[ 0.0% - 0.5% ] 0.49% | 89,132 | 8.2% |
[ 0.5% - 1.0% ] 0.53% | 112,327 | 3.7% |
[ 0.5% - 1.0% ] 0.56% | 141,637 | 5.6% |
[ 0.5% - 1.0% ] 0.60% | 61,245 | 6.1% |
[ 0.5% - 1.0% ] 0.64% | 33,268 | 9.0% |
[ 0.5% - 1.0% ] 0.68% | 21,173 | 8.6% |
[ 0.5% - 1.0% ] 0.72% | 11,884 | 12.1% |
[ 0.5% - 1.0% ] 0.77% | 10,896 | 14.5% |
[ 0.5% - 1.0% ] 0.80% | 15,734 | 6.7% |
[ 0.5% - 1.0% ] 0.82% | 21,939 | 6.5% |
[ 0.5% - 1.0% ] 0.87% | 113,604 | 6.1% |
[ 0.5% - 1.0% ] 0.90% | 3,788 | 5.1% |
[ 0.5% - 1.0% ] 0.94% | 6,177 | 13.0% |
[ 1.0% - 1.5% ] 1.03% | 10,788 | 7.3% |
[ 1.0% - 1.5% ] 1.06% | 26,591 | 7.4% |
[ 1.0% - 1.5% ] 1.11% | 5,856 | 8.6% |
[ 1.0% - 1.5% ] 1.16% | 1,719 | 18.6% |
[ 1.0% - 1.5% ] 1.20% | 2,000 | 5.2% |
[ 1.0% - 1.5% ] 1.22% | 5,014 | 11.3% |
[ 1.0% - 1.5% ] 1.26% | 2,782 | 11.8% |
[ 1.0% - 1.5% ] 1.33% | 2,185 | 7.2% |
[ 1.0% - 1.5% ] 1.47% | 9,955 | 0.41% |
[ 1.5% - 2.0% ] 1.54% | 7,262 | 1.6% |
[ 1.5% - 2.0% ] 1.58% | 1,263 | 16.8% |
[ 1.5% - 2.0% ] 1.62% | 616 | 9.0% |
[ 1.5% - 2.0% ] 1.66% | 13,722 | 1.7% |
[ 1.5% - 2.0% ] 1.81% | 1,661 | 14.7% |
[ 1.5% - 2.0% ] 1.84% | 2,552 | 25.9% |
[ 1.5% - 2.0% ] 1.97% | 1,220 | 4.6% |
[ 2.0% - 2.5% ] 2.09% | 287 | 10.9% |
[ 2.0% - 2.5% ] 2.15% | 10,440 | 1.6% |
[ 2.0% - 2.5% ] 2.25% | 267 | 8.6% |
[ 2.0% - 2.5% ] 2.35% | 810 | 10.7% |
[ 2.0% - 2.5% ] 2.40% | 4,166 | 12.6% |
[ 2.0% - 2.5% ] 2.45% | 204 | 8.4% |
[ 2.5% - 3.0% ] 2.63% | 2,890 | 8.1% |
[ 2.5% - 3.0% ] 2.84% | 211 | 20.0% |
[ 2.5% - 3.0% ] 2.98% | 1,240 | 23.5% |
[ 3.0% - 3.5% ] 3.25% | 1,910 | 1.9% |
[ 3.5% - 4.0% ] 3.73% | 456 | 24.2% |
[ 3.5% - 4.0% ] 3.79% | 554 | 24.1% |
[ 3.5% - 4.0% ] 3.87% | 4,468 | 2.7% |
[ 4.0% - 4.5% ] 4.41% | 681 | 5.8% |
[ 5.5% - 6.0% ] 5.71% | 368 | 10.3% |
[ 5.5% - 6.0% ] 5.72% | 787 | 6.4% |
[ 5.5% - 6.0% ] 5.86% | 324 | 22.4% |
[ 6.0% - 6.5% ] 6.08% | 609 | 10.5% |
[ 7.5% - 8.0% ] 7.78% | 360 | 4.6% |
[ 14.0% - 14.5% ] 14.35% | 216 | 9.5% |