Immigrants from Belgium Disability
COMPARE
Immigrants from Belgium
Select to Compare
Disability
Immigrants from Belgium Disability
11.0%
DISABILITY
99.3/ 100
METRIC RATING
77th/ 347
METRIC RANK
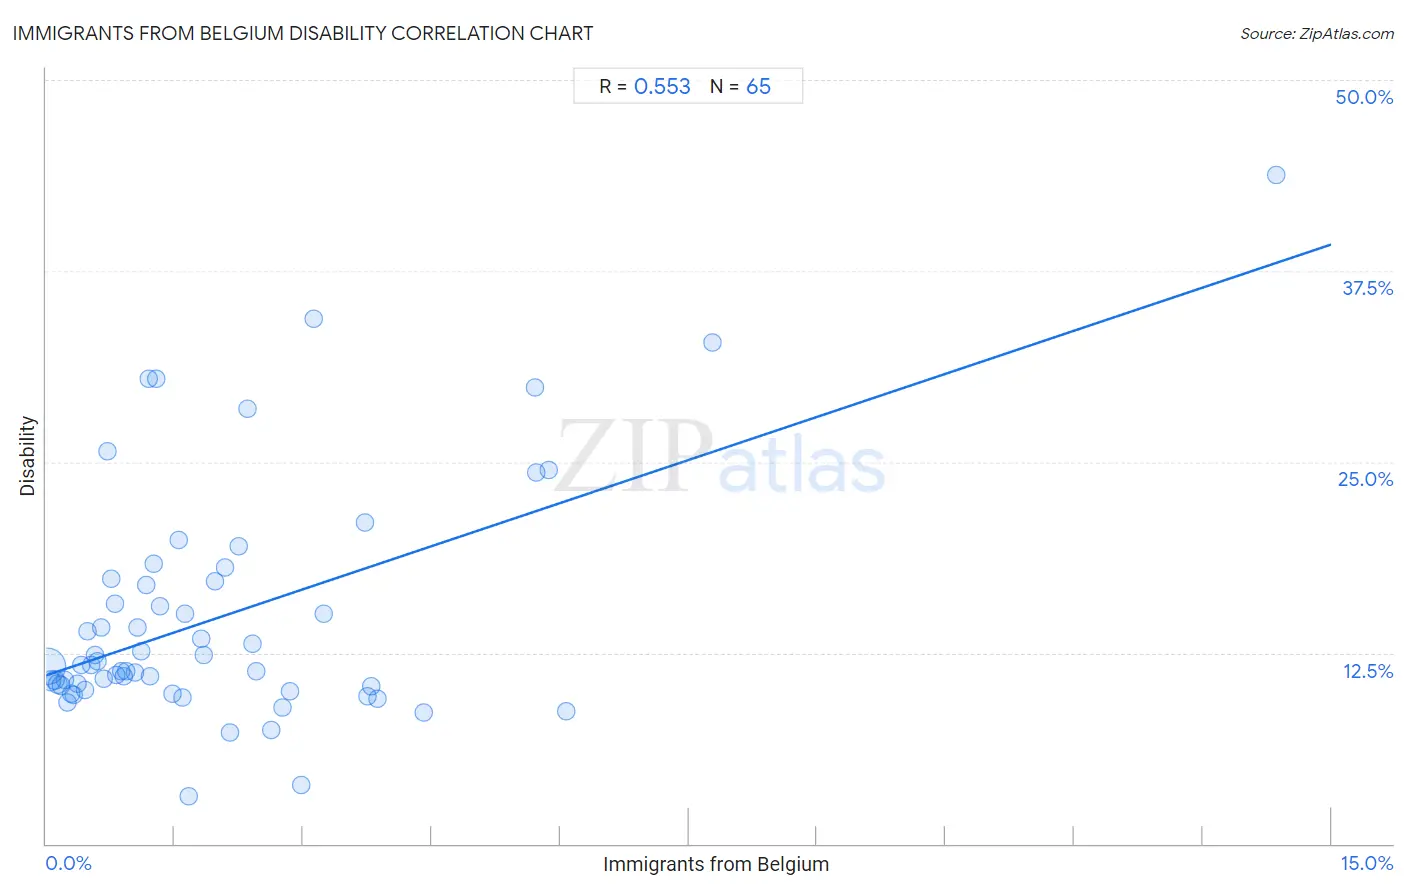
Immigrants from Belgium Disability Correlation Chart
The statistical analysis conducted on geographies consisting of 146,717,814 people shows a substantial positive correlation between the proportion of Immigrants from Belgium and percentage of population with a disability in the United States with a correlation coefficient (R) of 0.553 and weighted average of 11.0%. On average, for every 1% (one percent) increase in Immigrants from Belgium within a typical geography, there is an increase of 1.9% in percentage of population with a disability.
It is essential to understand that the correlation between the percentage of Immigrants from Belgium and percentage of population with a disability does not imply a direct cause-and-effect relationship. It remains uncertain whether the presence of Immigrants from Belgium influences an upward or downward trend in the level of percentage of population with a disability within an area, or if Immigrants from Belgium simply ended up residing in those areas with higher or lower levels of percentage of population with a disability due to other factors.
Demographics Similar to Immigrants from Belgium by Disability
In terms of disability, the demographic groups most similar to Immigrants from Belgium are Sierra Leonean (11.0%, a difference of 0.0%), Immigrants from Vietnam (11.0%, a difference of 0.030%), Immigrants from Cameroon (11.1%, a difference of 0.040%), Immigrants from Serbia (11.0%, a difference of 0.050%), and Immigrants from Bangladesh (11.0%, a difference of 0.070%).
| Demographics | Rating | Rank | Disability |
| Immigrants from France | 99.4 /100 | #70 | Exceptional 11.0% |
| Immigrants from Lebanon | 99.4 /100 | #71 | Exceptional 11.0% |
| Immigrants from Chile | 99.4 /100 | #72 | Exceptional 11.0% |
| Immigrants from Bangladesh | 99.4 /100 | #73 | Exceptional 11.0% |
| Immigrants from Serbia | 99.4 /100 | #74 | Exceptional 11.0% |
| Immigrants from Vietnam | 99.4 /100 | #75 | Exceptional 11.0% |
| Sierra Leoneans | 99.3 /100 | #76 | Exceptional 11.0% |
| Immigrants from Belgium | 99.3 /100 | #77 | Exceptional 11.0% |
| Immigrants from Cameroon | 99.3 /100 | #78 | Exceptional 11.1% |
| Immigrants from Jordan | 99.3 /100 | #79 | Exceptional 11.1% |
| Immigrants from Ireland | 99.3 /100 | #80 | Exceptional 11.1% |
| Immigrants from Poland | 99.1 /100 | #81 | Exceptional 11.1% |
| Chileans | 99.1 /100 | #82 | Exceptional 11.1% |
| Immigrants from Switzerland | 99.0 /100 | #83 | Exceptional 11.1% |
| Immigrants from Sierra Leone | 99.0 /100 | #84 | Exceptional 11.1% |
Immigrants from Belgium Disability Correlation Summary
| Measurement | Immigrants from Belgium Data | Disability Data |
| Minimum | 0.016% | 3.1% |
| Maximum | 14.4% | 43.8% |
| Range | 14.3% | 40.7% |
| Mean | 2.0% | 14.9% |
| Median | 1.3% | 11.7% |
| Interquartile 25% (IQ1) | 0.62% | 10.2% |
| Interquartile 75% (IQ3) | 2.7% | 17.3% |
| Interquartile Range (IQR) | 2.1% | 7.1% |
| Standard Deviation (Sample) | 2.3% | 7.8% |
| Standard Deviation (Population) | 2.3% | 7.7% |
Correlation Details
| Immigrants from Belgium Percentile | Sample Size | Disability |
[ 0.0% - 0.5% ] 0.016% | 108,560,930 | 11.6% |
[ 0.0% - 0.5% ] 0.055% | 19,821,431 | 10.7% |
[ 0.0% - 0.5% ] 0.096% | 7,796,512 | 10.7% |
[ 0.0% - 0.5% ] 0.13% | 3,542,246 | 10.5% |
[ 0.0% - 0.5% ] 0.17% | 2,641,857 | 10.4% |
[ 0.0% - 0.5% ] 0.21% | 1,157,023 | 10.8% |
[ 0.0% - 0.5% ] 0.25% | 665,072 | 9.3% |
[ 0.0% - 0.5% ] 0.29% | 637,844 | 9.8% |
[ 0.0% - 0.5% ] 0.33% | 389,230 | 9.7% |
[ 0.0% - 0.5% ] 0.37% | 235,042 | 10.5% |
[ 0.0% - 0.5% ] 0.40% | 267,374 | 11.7% |
[ 0.0% - 0.5% ] 0.45% | 170,055 | 10.1% |
[ 0.0% - 0.5% ] 0.49% | 89,132 | 13.9% |
[ 0.5% - 1.0% ] 0.53% | 143,186 | 11.7% |
[ 0.5% - 1.0% ] 0.56% | 141,637 | 12.4% |
[ 0.5% - 1.0% ] 0.60% | 63,294 | 11.9% |
[ 0.5% - 1.0% ] 0.64% | 33,268 | 14.2% |
[ 0.5% - 1.0% ] 0.68% | 22,955 | 10.8% |
[ 0.5% - 1.0% ] 0.72% | 11,884 | 25.7% |
[ 0.5% - 1.0% ] 0.76% | 25,403 | 17.4% |
[ 0.5% - 1.0% ] 0.80% | 15,734 | 15.7% |
[ 0.5% - 1.0% ] 0.82% | 25,983 | 11.1% |
[ 0.5% - 1.0% ] 0.87% | 113,604 | 11.3% |
[ 0.5% - 1.0% ] 0.90% | 3,788 | 11.0% |
[ 0.5% - 1.0% ] 0.94% | 6,282 | 11.3% |
[ 1.0% - 1.5% ] 1.03% | 10,788 | 11.2% |
[ 1.0% - 1.5% ] 1.06% | 28,543 | 14.2% |
[ 1.0% - 1.5% ] 1.11% | 5,856 | 12.6% |
[ 1.0% - 1.5% ] 1.16% | 1,719 | 17.0% |
[ 1.0% - 1.5% ] 1.20% | 2,000 | 30.5% |
[ 1.0% - 1.5% ] 1.22% | 5,014 | 11.0% |
[ 1.0% - 1.5% ] 1.26% | 2,782 | 18.4% |
[ 1.0% - 1.5% ] 1.29% | 233 | 30.5% |
[ 1.0% - 1.5% ] 1.33% | 2,407 | 15.5% |
[ 1.0% - 1.5% ] 1.47% | 9,955 | 9.8% |
[ 1.5% - 2.0% ] 1.54% | 7,262 | 19.9% |
[ 1.5% - 2.0% ] 1.58% | 1,263 | 9.6% |
[ 1.5% - 2.0% ] 1.62% | 616 | 15.1% |
[ 1.5% - 2.0% ] 1.66% | 13,722 | 3.1% |
[ 1.5% - 2.0% ] 1.81% | 1,661 | 13.4% |
[ 1.5% - 2.0% ] 1.84% | 2,552 | 12.3% |
[ 1.5% - 2.0% ] 1.97% | 1,220 | 17.2% |
[ 2.0% - 2.5% ] 2.09% | 287 | 18.1% |
[ 2.0% - 2.5% ] 2.15% | 10,440 | 7.3% |
[ 2.0% - 2.5% ] 2.25% | 267 | 19.5% |
[ 2.0% - 2.5% ] 2.35% | 810 | 28.5% |
[ 2.0% - 2.5% ] 2.40% | 4,166 | 13.1% |
[ 2.0% - 2.5% ] 2.45% | 204 | 11.3% |
[ 2.5% - 3.0% ] 2.63% | 2,890 | 7.4% |
[ 2.5% - 3.0% ] 2.76% | 7,317 | 8.9% |
[ 2.5% - 3.0% ] 2.84% | 211 | 10.0% |
[ 2.5% - 3.0% ] 2.98% | 1,240 | 3.9% |
[ 3.0% - 3.5% ] 3.12% | 64 | 34.4% |
[ 3.0% - 3.5% ] 3.25% | 1,910 | 15.1% |
[ 3.5% - 4.0% ] 3.73% | 456 | 21.1% |
[ 3.5% - 4.0% ] 3.75% | 826 | 9.7% |
[ 3.5% - 4.0% ] 3.79% | 554 | 10.3% |
[ 3.5% - 4.0% ] 3.87% | 4,468 | 9.5% |
[ 4.0% - 4.5% ] 4.41% | 681 | 8.6% |
[ 5.5% - 6.0% ] 5.71% | 368 | 29.9% |
[ 5.5% - 6.0% ] 5.72% | 787 | 24.3% |
[ 5.5% - 6.0% ] 5.86% | 324 | 24.4% |
[ 6.0% - 6.5% ] 6.08% | 609 | 8.7% |
[ 7.5% - 8.0% ] 7.78% | 360 | 32.8% |
[ 14.0% - 14.5% ] 14.35% | 216 | 43.8% |