Immigrants from Barbados Married-Couple Family Poverty
COMPARE
Immigrants from Barbados
Select to Compare
Married-Couple Family Poverty
Immigrants from Barbados Married-Couple Family Poverty
6.5%
POVERTY | MARRIED-COUPLE FAMILIES
0.0/ 100
METRIC RATING
290th/ 347
METRIC RANK
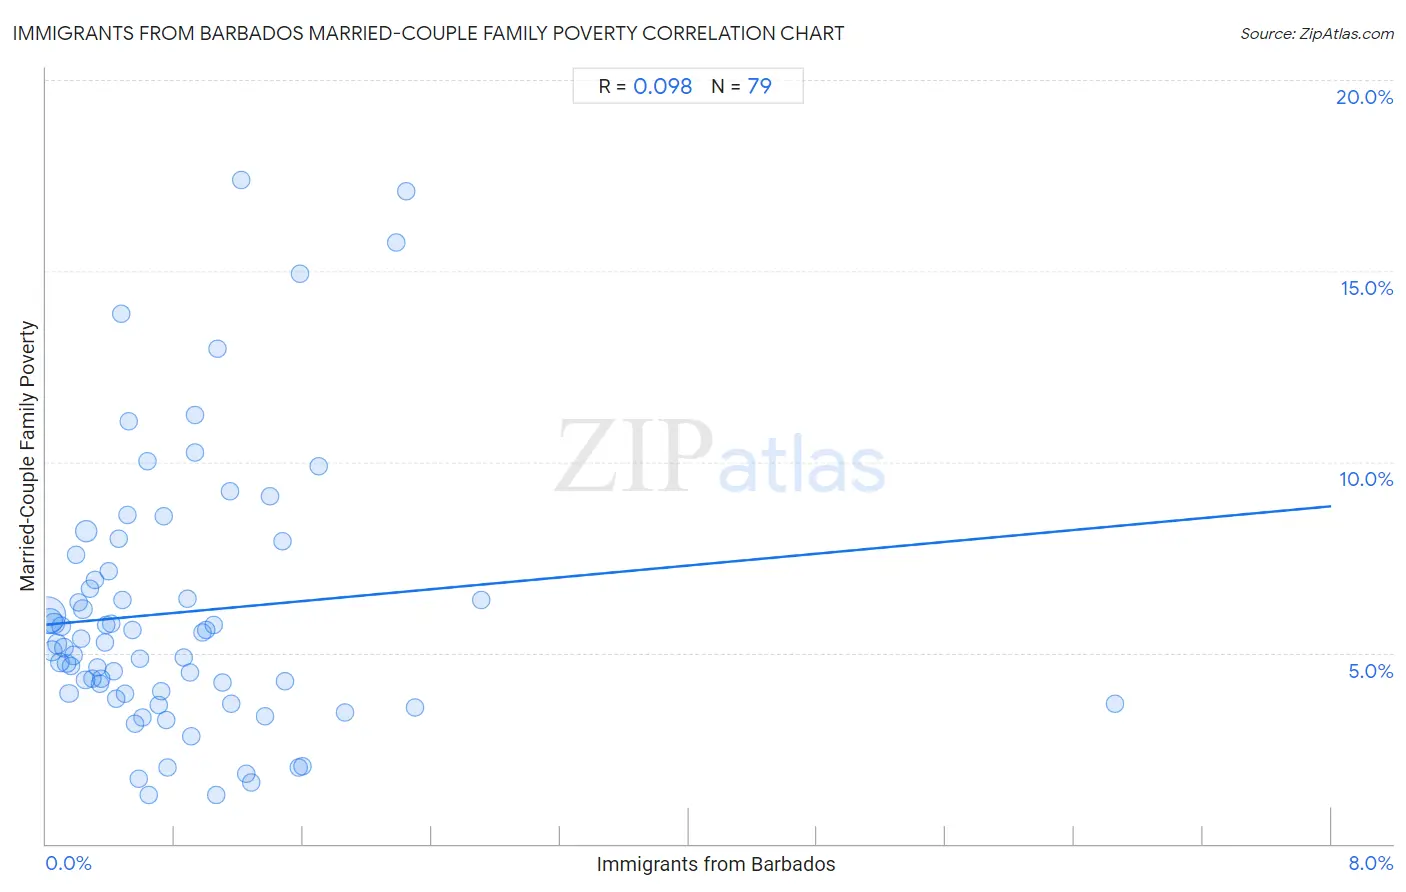
Immigrants from Barbados Married-Couple Family Poverty Correlation Chart
The statistical analysis conducted on geographies consisting of 112,495,981 people shows a slight positive correlation between the proportion of Immigrants from Barbados and poverty level among married-couple families in the United States with a correlation coefficient (R) of 0.098 and weighted average of 6.5%. On average, for every 1% (one percent) increase in Immigrants from Barbados within a typical geography, there is an increase of 0.39% in poverty level among married-couple families.
It is essential to understand that the correlation between the percentage of Immigrants from Barbados and poverty level among married-couple families does not imply a direct cause-and-effect relationship. It remains uncertain whether the presence of Immigrants from Barbados influences an upward or downward trend in the level of poverty level among married-couple families within an area, or if Immigrants from Barbados simply ended up residing in those areas with higher or lower levels of poverty level among married-couple families due to other factors.
Demographics Similar to Immigrants from Barbados by Married-Couple Family Poverty
In terms of married-couple family poverty, the demographic groups most similar to Immigrants from Barbados are Belizean (6.5%, a difference of 0.040%), Immigrants from Lebanon (6.6%, a difference of 0.21%), Nepalese (6.5%, a difference of 0.23%), Arapaho (6.6%, a difference of 0.29%), and Salvadoran (6.5%, a difference of 0.40%).
| Demographics | Rating | Rank | Married-Couple Family Poverty |
| Ute | 0.0 /100 | #283 | Tragic 6.4% |
| Dutch West Indians | 0.0 /100 | #284 | Tragic 6.4% |
| Blacks/African Americans | 0.0 /100 | #285 | Tragic 6.5% |
| Guyanese | 0.0 /100 | #286 | Tragic 6.5% |
| Ecuadorians | 0.0 /100 | #287 | Tragic 6.5% |
| Salvadorans | 0.0 /100 | #288 | Tragic 6.5% |
| Nepalese | 0.0 /100 | #289 | Tragic 6.5% |
| Immigrants from Barbados | 0.0 /100 | #290 | Tragic 6.5% |
| Belizeans | 0.0 /100 | #291 | Tragic 6.5% |
| Immigrants from Lebanon | 0.0 /100 | #292 | Tragic 6.6% |
| Arapaho | 0.0 /100 | #293 | Tragic 6.6% |
| Bahamians | 0.0 /100 | #294 | Tragic 6.6% |
| Immigrants from Uzbekistan | 0.0 /100 | #295 | Tragic 6.6% |
| U.S. Virgin Islanders | 0.0 /100 | #296 | Tragic 6.6% |
| Kiowa | 0.0 /100 | #297 | Tragic 6.6% |
Immigrants from Barbados Married-Couple Family Poverty Correlation Summary
| Measurement | Immigrants from Barbados Data | Married-Couple Family Poverty Data |
| Minimum | 0.0056% | 1.3% |
| Maximum | 6.7% | 17.4% |
| Range | 6.6% | 16.1% |
| Mean | 0.82% | 6.1% |
| Median | 0.58% | 5.2% |
| Interquartile 25% (IQ1) | 0.29% | 3.9% |
| Interquartile 75% (IQ3) | 1.1% | 7.1% |
| Interquartile Range (IQR) | 0.81% | 3.2% |
| Standard Deviation (Sample) | 0.89% | 3.5% |
| Standard Deviation (Population) | 0.89% | 3.5% |
Correlation Details
| Immigrants from Barbados Percentile | Sample Size | Married-Couple Family Poverty |
[ 0.0% - 0.5% ] 0.0056% | 43,535,033 | 6.0% |
[ 0.0% - 0.5% ] 0.022% | 18,056,608 | 5.8% |
[ 0.0% - 0.5% ] 0.037% | 7,657,578 | 5.0% |
[ 0.0% - 0.5% ] 0.050% | 7,108,900 | 5.8% |
[ 0.0% - 0.5% ] 0.066% | 4,639,494 | 5.2% |
[ 0.0% - 0.5% ] 0.082% | 3,373,679 | 4.8% |
[ 0.0% - 0.5% ] 0.096% | 2,792,658 | 5.7% |
[ 0.0% - 0.5% ] 0.11% | 2,106,840 | 5.1% |
[ 0.0% - 0.5% ] 0.13% | 1,487,627 | 4.7% |
[ 0.0% - 0.5% ] 0.14% | 1,355,789 | 3.9% |
[ 0.0% - 0.5% ] 0.15% | 1,356,417 | 4.7% |
[ 0.0% - 0.5% ] 0.17% | 1,167,954 | 4.9% |
[ 0.0% - 0.5% ] 0.18% | 817,184 | 7.6% |
[ 0.0% - 0.5% ] 0.20% | 604,020 | 6.3% |
[ 0.0% - 0.5% ] 0.21% | 577,808 | 5.4% |
[ 0.0% - 0.5% ] 0.23% | 1,140,061 | 6.1% |
[ 0.0% - 0.5% ] 0.25% | 382,788 | 4.3% |
[ 0.0% - 0.5% ] 0.25% | 8,921,337 | 8.2% |
[ 0.0% - 0.5% ] 0.27% | 204,369 | 6.7% |
[ 0.0% - 0.5% ] 0.29% | 396,800 | 4.3% |
[ 0.0% - 0.5% ] 0.30% | 347,878 | 6.9% |
[ 0.0% - 0.5% ] 0.32% | 585,060 | 4.6% |
[ 0.0% - 0.5% ] 0.33% | 189,363 | 4.2% |
[ 0.0% - 0.5% ] 0.35% | 248,369 | 4.3% |
[ 0.0% - 0.5% ] 0.36% | 88,972 | 5.3% |
[ 0.0% - 0.5% ] 0.38% | 145,941 | 5.7% |
[ 0.0% - 0.5% ] 0.39% | 151,915 | 7.1% |
[ 0.0% - 0.5% ] 0.41% | 193,965 | 5.8% |
[ 0.0% - 0.5% ] 0.42% | 116,411 | 4.5% |
[ 0.0% - 0.5% ] 0.44% | 198,556 | 3.8% |
[ 0.0% - 0.5% ] 0.46% | 67,467 | 8.0% |
[ 0.0% - 0.5% ] 0.47% | 71,125 | 13.9% |
[ 0.0% - 0.5% ] 0.48% | 183,572 | 6.4% |
[ 0.0% - 0.5% ] 0.49% | 49,011 | 3.9% |
[ 0.5% - 1.0% ] 0.51% | 146,085 | 8.6% |
[ 0.5% - 1.0% ] 0.52% | 5,035 | 11.1% |
[ 0.5% - 1.0% ] 0.54% | 56,920 | 5.6% |
[ 0.5% - 1.0% ] 0.55% | 5,249 | 3.1% |
[ 0.5% - 1.0% ] 0.57% | 21,329 | 1.7% |
[ 0.5% - 1.0% ] 0.58% | 154,903 | 4.9% |
[ 0.5% - 1.0% ] 0.60% | 70,359 | 3.3% |
[ 0.5% - 1.0% ] 0.63% | 122,569 | 10.0% |
[ 0.5% - 1.0% ] 0.64% | 2,811 | 1.3% |
[ 0.5% - 1.0% ] 0.70% | 3,719 | 3.6% |
[ 0.5% - 1.0% ] 0.72% | 104,504 | 4.0% |
[ 0.5% - 1.0% ] 0.73% | 97,858 | 8.6% |
[ 0.5% - 1.0% ] 0.75% | 7,347 | 3.2% |
[ 0.5% - 1.0% ] 0.76% | 2,373 | 2.0% |
[ 0.5% - 1.0% ] 0.86% | 38,865 | 4.9% |
[ 0.5% - 1.0% ] 0.88% | 101,053 | 6.4% |
[ 0.5% - 1.0% ] 0.89% | 65,177 | 4.5% |
[ 0.5% - 1.0% ] 0.90% | 32,296 | 2.8% |
[ 0.5% - 1.0% ] 0.93% | 6,485 | 11.2% |
[ 0.5% - 1.0% ] 0.93% | 91,236 | 10.2% |
[ 0.5% - 1.0% ] 0.97% | 24,994 | 5.5% |
[ 0.5% - 1.0% ] 1.00% | 63,426 | 5.6% |
[ 1.0% - 1.5% ] 1.04% | 95,914 | 5.7% |
[ 1.0% - 1.5% ] 1.06% | 4,240 | 1.3% |
[ 1.0% - 1.5% ] 1.06% | 122,545 | 13.0% |
[ 1.0% - 1.5% ] 1.10% | 26,687 | 4.2% |
[ 1.0% - 1.5% ] 1.14% | 1,138 | 9.2% |
[ 1.0% - 1.5% ] 1.15% | 14,253 | 3.7% |
[ 1.0% - 1.5% ] 1.22% | 84,006 | 17.4% |
[ 1.0% - 1.5% ] 1.25% | 44,832 | 1.8% |
[ 1.0% - 1.5% ] 1.27% | 24,044 | 1.6% |
[ 1.0% - 1.5% ] 1.36% | 882 | 3.3% |
[ 1.0% - 1.5% ] 1.39% | 38,335 | 9.1% |
[ 1.0% - 1.5% ] 1.47% | 83,125 | 7.9% |
[ 1.0% - 1.5% ] 1.49% | 62,373 | 4.2% |
[ 1.5% - 2.0% ] 1.57% | 10,631 | 2.0% |
[ 1.5% - 2.0% ] 1.58% | 69,131 | 14.9% |
[ 1.5% - 2.0% ] 1.59% | 10,482 | 2.0% |
[ 1.5% - 2.0% ] 1.69% | 58,476 | 9.9% |
[ 1.5% - 2.0% ] 1.86% | 100,082 | 3.4% |
[ 2.0% - 2.5% ] 2.18% | 5,373 | 15.7% |
[ 2.0% - 2.5% ] 2.24% | 5,226 | 17.1% |
[ 2.0% - 2.5% ] 2.30% | 9,010 | 3.6% |
[ 2.5% - 3.0% ] 2.71% | 78,506 | 6.4% |
[ 6.5% - 7.0% ] 6.65% | 1,548 | 3.7% |