Immigrants from Barbados Married-couple Households
COMPARE
Immigrants from Barbados
Select to Compare
Married-couple Households
Immigrants from Barbados Married-couple Households
39.2%
MARRIED-COUPLE HOUSEHOLDS
0.0/ 100
METRIC RATING
330th/ 347
METRIC RANK
Immigrants from Barbados Married-couple Households Correlation Chart
The statistical analysis conducted on geographies consisting of 112,771,790 people shows a poor positive correlation between the proportion of Immigrants from Barbados and percentage of married-couple family households in the United States with a correlation coefficient (R) of 0.157 and weighted average of 39.2%. On average, for every 1% (one percent) increase in Immigrants from Barbados within a typical geography, there is an increase of 1.9% in percentage of married-couple family households.
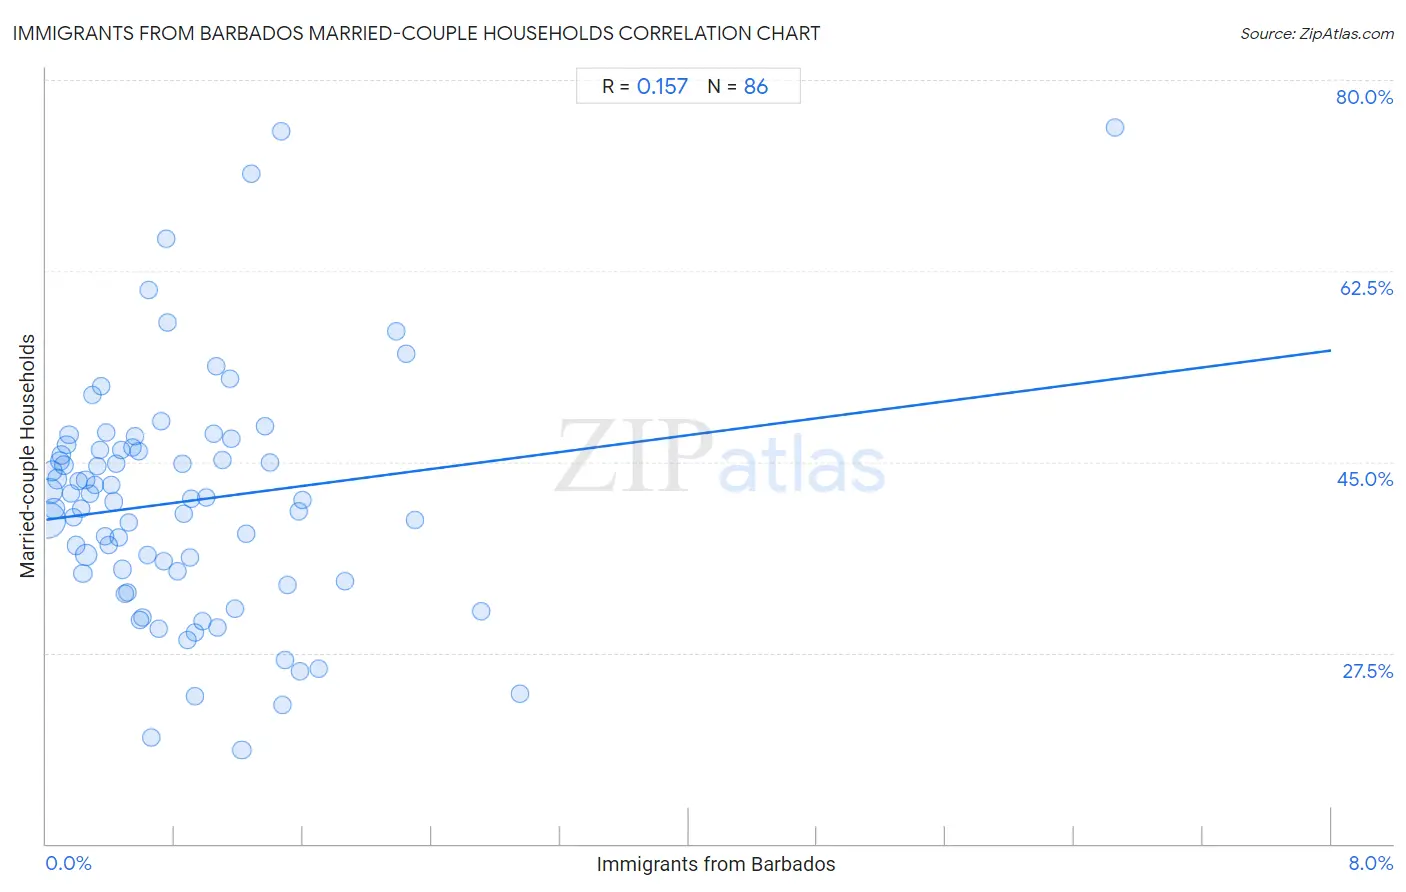
It is essential to understand that the correlation between the percentage of Immigrants from Barbados and percentage of married-couple family households does not imply a direct cause-and-effect relationship. It remains uncertain whether the presence of Immigrants from Barbados influences an upward or downward trend in the level of percentage of married-couple family households within an area, or if Immigrants from Barbados simply ended up residing in those areas with higher or lower levels of percentage of married-couple family households due to other factors.
Demographics Similar to Immigrants from Barbados by Married-couple Households
In terms of married-couple households, the demographic groups most similar to Immigrants from Barbados are Immigrants from Dominica (39.4%, a difference of 0.44%), Immigrants from Congo (39.0%, a difference of 0.44%), Barbadian (39.4%, a difference of 0.52%), Somali (39.0%, a difference of 0.52%), and Immigrants from West Indies (39.0%, a difference of 0.56%).
| Demographics | Rating | Rank | Married-couple Households |
| Puerto Ricans | 0.0 /100 | #323 | Tragic 40.1% |
| Navajo | 0.0 /100 | #324 | Tragic 40.1% |
| Pueblo | 0.0 /100 | #325 | Tragic 40.0% |
| U.S. Virgin Islanders | 0.0 /100 | #326 | Tragic 39.8% |
| Lumbee | 0.0 /100 | #327 | Tragic 39.6% |
| Barbadians | 0.0 /100 | #328 | Tragic 39.4% |
| Immigrants from Dominica | 0.0 /100 | #329 | Tragic 39.4% |
| Immigrants from Barbados | 0.0 /100 | #330 | Tragic 39.2% |
| Immigrants from Congo | 0.0 /100 | #331 | Tragic 39.0% |
| Somalis | 0.0 /100 | #332 | Tragic 39.0% |
| Immigrants from West Indies | 0.0 /100 | #333 | Tragic 39.0% |
| Immigrants from St. Vincent and the Grenadines | 0.0 /100 | #334 | Tragic 38.7% |
| Senegalese | 0.0 /100 | #335 | Tragic 38.6% |
| Blacks/African Americans | 0.0 /100 | #336 | Tragic 38.5% |
| Immigrants from Somalia | 0.0 /100 | #337 | Tragic 38.4% |
Immigrants from Barbados Married-couple Households Correlation Summary
| Measurement | Immigrants from Barbados Data | Married-couple Households Data |
| Minimum | 0.0056% | 18.6% |
| Maximum | 6.7% | 75.7% |
| Range | 6.6% | 57.1% |
| Mean | 0.87% | 41.4% |
| Median | 0.65% | 41.6% |
| Interquartile 25% (IQ1) | 0.32% | 34.8% |
| Interquartile 75% (IQ3) | 1.2% | 46.1% |
| Interquartile Range (IQR) | 0.83% | 11.3% |
| Standard Deviation (Sample) | 0.89% | 11.0% |
| Standard Deviation (Population) | 0.89% | 10.9% |
Correlation Details
| Immigrants from Barbados Percentile | Sample Size | Married-couple Households |
[ 0.0% - 0.5% ] 0.0056% | 43,535,033 | 39.6% |
[ 0.0% - 0.5% ] 0.022% | 18,088,945 | 42.3% |
[ 0.0% - 0.5% ] 0.037% | 7,691,805 | 44.2% |
[ 0.0% - 0.5% ] 0.050% | 7,108,900 | 40.7% |
[ 0.0% - 0.5% ] 0.066% | 4,666,602 | 43.4% |
[ 0.0% - 0.5% ] 0.082% | 3,381,947 | 45.1% |
[ 0.0% - 0.5% ] 0.096% | 2,799,422 | 45.7% |
[ 0.0% - 0.5% ] 0.11% | 2,132,743 | 44.7% |
[ 0.0% - 0.5% ] 0.13% | 1,487,627 | 46.6% |
[ 0.0% - 0.5% ] 0.14% | 1,358,517 | 47.5% |
[ 0.0% - 0.5% ] 0.15% | 1,358,362 | 42.1% |
[ 0.0% - 0.5% ] 0.17% | 1,167,954 | 39.9% |
[ 0.0% - 0.5% ] 0.18% | 820,447 | 37.3% |
[ 0.0% - 0.5% ] 0.20% | 611,104 | 43.2% |
[ 0.0% - 0.5% ] 0.21% | 577,808 | 40.7% |
[ 0.0% - 0.5% ] 0.23% | 1,172,657 | 34.8% |
[ 0.0% - 0.5% ] 0.25% | 393,423 | 43.3% |
[ 0.0% - 0.5% ] 0.25% | 8,921,722 | 36.5% |
[ 0.0% - 0.5% ] 0.27% | 204,369 | 42.1% |
[ 0.0% - 0.5% ] 0.29% | 401,607 | 51.2% |
[ 0.0% - 0.5% ] 0.30% | 347,878 | 42.9% |
[ 0.0% - 0.5% ] 0.32% | 585,060 | 44.6% |
[ 0.0% - 0.5% ] 0.33% | 189,363 | 46.1% |
[ 0.0% - 0.5% ] 0.35% | 252,325 | 51.9% |
[ 0.0% - 0.5% ] 0.36% | 88,972 | 38.2% |
[ 0.0% - 0.5% ] 0.38% | 150,471 | 47.7% |
[ 0.0% - 0.5% ] 0.39% | 151,915 | 37.4% |
[ 0.0% - 0.5% ] 0.41% | 193,965 | 42.9% |
[ 0.0% - 0.5% ] 0.42% | 116,411 | 41.3% |
[ 0.0% - 0.5% ] 0.44% | 210,767 | 44.8% |
[ 0.0% - 0.5% ] 0.46% | 67,467 | 38.1% |
[ 0.0% - 0.5% ] 0.47% | 71,125 | 46.1% |
[ 0.0% - 0.5% ] 0.48% | 183,572 | 35.1% |
[ 0.0% - 0.5% ] 0.49% | 55,143 | 32.9% |
[ 0.5% - 1.0% ] 0.51% | 146,085 | 33.0% |
[ 0.5% - 1.0% ] 0.52% | 5,035 | 39.4% |
[ 0.5% - 1.0% ] 0.54% | 56,920 | 46.3% |
[ 0.5% - 1.0% ] 0.55% | 5,249 | 47.3% |
[ 0.5% - 1.0% ] 0.57% | 21,329 | 46.0% |
[ 0.5% - 1.0% ] 0.58% | 156,769 | 30.6% |
[ 0.5% - 1.0% ] 0.60% | 76,548 | 30.7% |
[ 0.5% - 1.0% ] 0.63% | 122,569 | 36.4% |
[ 0.5% - 1.0% ] 0.64% | 2,811 | 60.7% |
[ 0.5% - 1.0% ] 0.65% | 2,144 | 19.8% |
[ 0.5% - 1.0% ] 0.70% | 3,719 | 29.7% |
[ 0.5% - 1.0% ] 0.72% | 104,504 | 48.7% |
[ 0.5% - 1.0% ] 0.73% | 97,858 | 35.9% |
[ 0.5% - 1.0% ] 0.75% | 7,347 | 65.5% |
[ 0.5% - 1.0% ] 0.76% | 2,373 | 57.8% |
[ 0.5% - 1.0% ] 0.82% | 856 | 35.0% |
[ 0.5% - 1.0% ] 0.85% | 9,389 | 44.8% |
[ 0.5% - 1.0% ] 0.86% | 38,865 | 40.2% |
[ 0.5% - 1.0% ] 0.88% | 101,053 | 28.7% |
[ 0.5% - 1.0% ] 0.89% | 66,415 | 36.2% |
[ 0.5% - 1.0% ] 0.90% | 32,296 | 41.7% |
[ 0.5% - 1.0% ] 0.93% | 6,485 | 29.4% |
[ 0.5% - 1.0% ] 0.93% | 91,236 | 23.5% |
[ 0.5% - 1.0% ] 0.97% | 24,994 | 30.4% |
[ 0.5% - 1.0% ] 1.00% | 67,357 | 41.7% |
[ 1.0% - 1.5% ] 1.04% | 95,914 | 47.6% |
[ 1.0% - 1.5% ] 1.06% | 4,240 | 53.7% |
[ 1.0% - 1.5% ] 1.06% | 122,545 | 29.8% |
[ 1.0% - 1.5% ] 1.10% | 26,687 | 45.1% |
[ 1.0% - 1.5% ] 1.14% | 1,138 | 52.6% |
[ 1.0% - 1.5% ] 1.15% | 14,253 | 47.1% |
[ 1.0% - 1.5% ] 1.17% | 1,194 | 31.5% |
[ 1.0% - 1.5% ] 1.22% | 85,891 | 18.6% |
[ 1.0% - 1.5% ] 1.25% | 44,832 | 38.4% |
[ 1.0% - 1.5% ] 1.27% | 24,044 | 71.4% |
[ 1.0% - 1.5% ] 1.36% | 882 | 48.3% |
[ 1.0% - 1.5% ] 1.39% | 46,955 | 44.9% |
[ 1.0% - 1.5% ] 1.46% | 1,918 | 75.4% |
[ 1.0% - 1.5% ] 1.47% | 83,125 | 22.7% |
[ 1.0% - 1.5% ] 1.49% | 62,373 | 26.9% |
[ 1.5% - 2.0% ] 1.50% | 9,124 | 33.7% |
[ 1.5% - 2.0% ] 1.57% | 10,631 | 40.5% |
[ 1.5% - 2.0% ] 1.58% | 69,131 | 25.8% |
[ 1.5% - 2.0% ] 1.59% | 10,482 | 41.5% |
[ 1.5% - 2.0% ] 1.69% | 58,476 | 26.0% |
[ 1.5% - 2.0% ] 1.86% | 100,082 | 34.1% |
[ 2.0% - 2.5% ] 2.18% | 5,373 | 57.0% |
[ 2.0% - 2.5% ] 2.24% | 5,226 | 54.9% |
[ 2.0% - 2.5% ] 2.30% | 9,010 | 39.7% |
[ 2.5% - 3.0% ] 2.71% | 78,506 | 31.3% |
[ 2.5% - 3.0% ] 2.95% | 2,576 | 23.8% |
[ 6.5% - 7.0% ] 6.65% | 1,548 | 75.7% |