Dominican Unemployment Among Women with Children Ages 6 to 17 years
COMPARE
Dominican
Select to Compare
Unemployment Among Women with Children Ages 6 to 17 years
Dominican Unemployment Among Women with Children Ages 6 to 17 years
10.8%
UNEMPLOYMENT | WOMEN W/ CHILDREN 6 TO 17
0.0/ 100
METRIC RATING
323rd/ 347
METRIC RANK
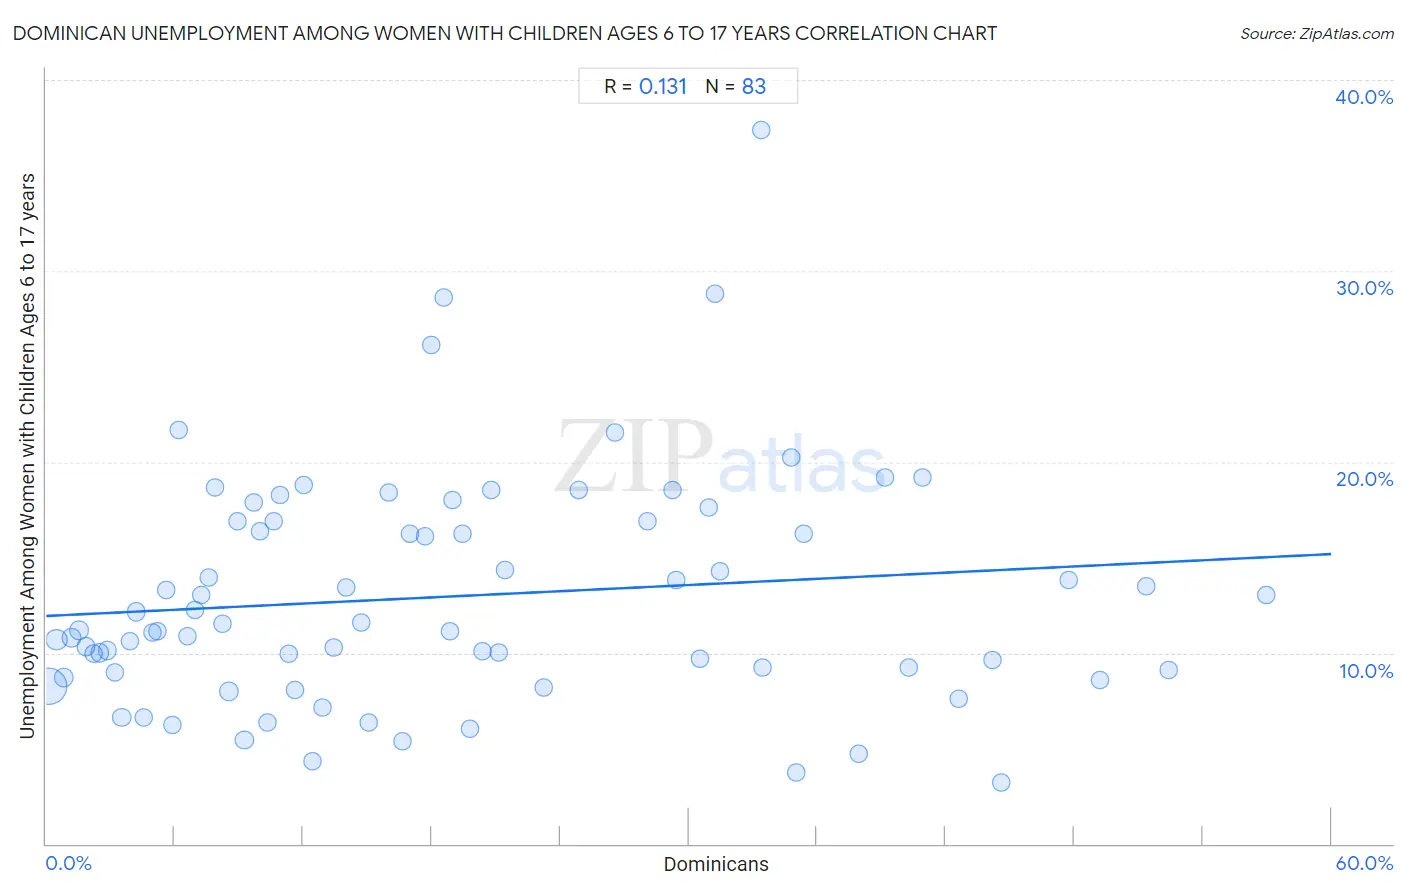
Dominican Unemployment Among Women with Children Ages 6 to 17 years Correlation Chart
The statistical analysis conducted on geographies consisting of 262,781,986 people shows a poor positive correlation between the proportion of Dominicans and unemployment rate among women with children between the ages 6 and 17 in the United States with a correlation coefficient (R) of 0.131 and weighted average of 10.8%. On average, for every 1% (one percent) increase in Dominicans within a typical geography, there is an increase of 0.054% in unemployment rate among women with children between the ages 6 and 17.
It is essential to understand that the correlation between the percentage of Dominicans and unemployment rate among women with children between the ages 6 and 17 does not imply a direct cause-and-effect relationship. It remains uncertain whether the presence of Dominicans influences an upward or downward trend in the level of unemployment rate among women with children between the ages 6 and 17 within an area, or if Dominicans simply ended up residing in those areas with higher or lower levels of unemployment rate among women with children between the ages 6 and 17 due to other factors.
Demographics Similar to Dominicans by Unemployment Among Women with Children Ages 6 to 17 years
In terms of unemployment among women with children ages 6 to 17 years, the demographic groups most similar to Dominicans are Cree (10.8%, a difference of 0.050%), Immigrants from Dominican Republic (10.8%, a difference of 0.060%), Cajun (10.8%, a difference of 0.24%), Liberian (10.8%, a difference of 0.31%), and Cape Verdean (10.9%, a difference of 0.38%).
| Demographics | Rating | Rank | Unemployment Among Women with Children Ages 6 to 17 years |
| Immigrants from Dominica | 0.0 /100 | #316 | Tragic 10.5% |
| Bermudans | 0.0 /100 | #317 | Tragic 10.5% |
| Delaware | 0.0 /100 | #318 | Tragic 10.5% |
| Immigrants from Uganda | 0.0 /100 | #319 | Tragic 10.7% |
| Apache | 0.0 /100 | #320 | Tragic 10.7% |
| Tohono O'odham | 0.0 /100 | #321 | Tragic 10.7% |
| Cree | 0.0 /100 | #322 | Tragic 10.8% |
| Dominicans | 0.0 /100 | #323 | Tragic 10.8% |
| Immigrants from Dominican Republic | 0.0 /100 | #324 | Tragic 10.8% |
| Cajuns | 0.0 /100 | #325 | Tragic 10.8% |
| Liberians | 0.0 /100 | #326 | Tragic 10.8% |
| Cape Verdeans | 0.0 /100 | #327 | Tragic 10.9% |
| Ottawa | 0.0 /100 | #328 | Tragic 10.9% |
| Pennsylvania Germans | 0.0 /100 | #329 | Tragic 11.0% |
| Chippewa | 0.0 /100 | #330 | Tragic 11.1% |
Dominican Unemployment Among Women with Children Ages 6 to 17 years Correlation Summary
| Measurement | Dominican Data | Unemployment Among Women with Children Ages 6 to 17 years Data |
| Minimum | 0.11% | 3.2% |
| Maximum | 57.0% | 37.4% |
| Range | 56.9% | 34.2% |
| Mean | 18.9% | 13.0% |
| Median | 15.1% | 11.2% |
| Interquartile 25% (IQ1) | 6.9% | 9.0% |
| Interquartile 75% (IQ3) | 30.5% | 16.9% |
| Interquartile Range (IQR) | 23.6% | 7.9% |
| Standard Deviation (Sample) | 14.7% | 6.1% |
| Standard Deviation (Population) | 14.6% | 6.0% |
Correlation Details
| Dominican Percentile | Sample Size | Unemployment Among Women with Children Ages 6 to 17 years |
[ 0.0% - 0.5% ] 0.11% | 169,476,899 | 8.2% |
[ 0.0% - 0.5% ] 0.48% | 27,706,827 | 10.7% |
[ 0.5% - 1.0% ] 0.83% | 10,685,847 | 8.7% |
[ 1.0% - 1.5% ] 1.18% | 6,739,986 | 10.8% |
[ 1.5% - 2.0% ] 1.52% | 5,658,639 | 11.2% |
[ 1.5% - 2.0% ] 1.84% | 4,573,978 | 10.3% |
[ 2.0% - 2.5% ] 2.20% | 2,659,723 | 10.0% |
[ 2.0% - 2.5% ] 2.49% | 5,153,783 | 10.0% |
[ 2.5% - 3.0% ] 2.83% | 2,431,767 | 10.1% |
[ 3.0% - 3.5% ] 3.23% | 2,037,305 | 9.0% |
[ 3.5% - 4.0% ] 3.53% | 2,128,705 | 6.6% |
[ 3.5% - 4.0% ] 3.90% | 1,093,961 | 10.6% |
[ 4.0% - 4.5% ] 4.22% | 893,032 | 12.1% |
[ 4.5% - 5.0% ] 4.55% | 651,616 | 6.6% |
[ 4.5% - 5.0% ] 4.96% | 440,300 | 11.1% |
[ 5.0% - 5.5% ] 5.20% | 621,452 | 11.1% |
[ 5.5% - 6.0% ] 5.59% | 561,201 | 13.3% |
[ 5.5% - 6.0% ] 5.88% | 1,251,672 | 6.2% |
[ 6.0% - 6.5% ] 6.20% | 302,873 | 21.7% |
[ 6.5% - 7.0% ] 6.61% | 868,371 | 10.9% |
[ 6.5% - 7.0% ] 6.94% | 892,382 | 12.2% |
[ 7.0% - 7.5% ] 7.26% | 277,735 | 13.0% |
[ 7.5% - 8.0% ] 7.59% | 344,803 | 13.9% |
[ 7.5% - 8.0% ] 7.89% | 498,647 | 18.6% |
[ 8.0% - 8.5% ] 8.22% | 102,827 | 11.5% |
[ 8.5% - 9.0% ] 8.55% | 8,660,920 | 8.0% |
[ 8.5% - 9.0% ] 8.93% | 120,982 | 16.9% |
[ 9.0% - 9.5% ] 9.25% | 313,111 | 5.4% |
[ 9.5% - 10.0% ] 9.69% | 192,507 | 17.9% |
[ 9.5% - 10.0% ] 9.97% | 123,114 | 16.4% |
[ 10.0% - 10.5% ] 10.33% | 253,792 | 6.3% |
[ 10.5% - 11.0% ] 10.65% | 320,880 | 16.9% |
[ 10.5% - 11.0% ] 10.94% | 129,525 | 18.3% |
[ 11.0% - 11.5% ] 11.30% | 222,335 | 10.0% |
[ 11.5% - 12.0% ] 11.61% | 145,944 | 8.1% |
[ 12.0% - 12.5% ] 12.03% | 140,396 | 18.8% |
[ 12.0% - 12.5% ] 12.44% | 27,996 | 4.3% |
[ 12.5% - 13.0% ] 12.91% | 112,934 | 7.1% |
[ 13.0% - 13.5% ] 13.44% | 156,675 | 10.3% |
[ 14.0% - 14.5% ] 14.03% | 232,404 | 13.4% |
[ 14.5% - 15.0% ] 14.70% | 119,137 | 11.6% |
[ 15.0% - 15.5% ] 15.05% | 261,271 | 6.4% |
[ 15.5% - 16.0% ] 15.99% | 176,953 | 18.4% |
[ 16.5% - 17.0% ] 16.61% | 105,592 | 5.4% |
[ 17.0% - 17.5% ] 17.01% | 192,980 | 16.3% |
[ 17.5% - 18.0% ] 17.70% | 117,602 | 16.1% |
[ 17.5% - 18.0% ] 17.98% | 135,069 | 26.1% |
[ 18.5% - 19.0% ] 18.57% | 5,260 | 28.6% |
[ 18.5% - 19.0% ] 18.84% | 96,311 | 11.1% |
[ 18.5% - 19.0% ] 18.98% | 26,322 | 18.0% |
[ 19.0% - 19.5% ] 19.45% | 53,296 | 16.2% |
[ 19.5% - 20.0% ] 19.79% | 65,283 | 6.0% |
[ 20.0% - 20.5% ] 20.37% | 128,533 | 10.1% |
[ 20.5% - 21.0% ] 20.79% | 189,715 | 18.5% |
[ 21.0% - 21.5% ] 21.16% | 111,727 | 10.0% |
[ 21.0% - 21.5% ] 21.42% | 73,231 | 14.4% |
[ 23.0% - 23.5% ] 23.26% | 140,096 | 8.2% |
[ 24.5% - 25.0% ] 24.86% | 95,009 | 18.6% |
[ 26.5% - 27.0% ] 26.57% | 110,952 | 21.6% |
[ 28.0% - 28.5% ] 28.05% | 51,964 | 16.9% |
[ 29.0% - 29.5% ] 29.27% | 59,852 | 18.5% |
[ 29.0% - 29.5% ] 29.40% | 157,864 | 13.8% |
[ 30.0% - 30.5% ] 30.50% | 61,044 | 9.7% |
[ 30.5% - 31.0% ] 30.95% | 79,817 | 17.6% |
[ 31.0% - 31.5% ] 31.23% | 24,572 | 28.8% |
[ 31.0% - 31.5% ] 31.45% | 11,069 | 14.3% |
[ 33.0% - 33.5% ] 33.36% | 25,674 | 37.4% |
[ 33.0% - 33.5% ] 33.44% | 15,139 | 9.2% |
[ 34.5% - 35.0% ] 34.77% | 82,678 | 20.2% |
[ 35.0% - 35.5% ] 35.00% | 78,624 | 3.7% |
[ 35.0% - 35.5% ] 35.36% | 49,273 | 16.2% |
[ 37.5% - 38.0% ] 37.93% | 18,461 | 4.7% |
[ 39.0% - 39.5% ] 39.15% | 58,136 | 19.2% |
[ 40.0% - 40.5% ] 40.29% | 111,904 | 9.3% |
[ 40.5% - 41.0% ] 40.92% | 55,226 | 19.2% |
[ 42.5% - 43.0% ] 42.59% | 29,671 | 7.6% |
[ 44.0% - 44.5% ] 44.17% | 58,711 | 9.6% |
[ 44.5% - 45.0% ] 44.59% | 32,697 | 3.2% |
[ 47.5% - 48.0% ] 47.73% | 81,397 | 13.8% |
[ 49.0% - 49.5% ] 49.23% | 41,570 | 8.6% |
[ 51.0% - 51.5% ] 51.35% | 43,653 | 13.5% |
[ 52.0% - 52.5% ] 52.39% | 88,067 | 9.1% |
[ 56.5% - 57.0% ] 56.99% | 52,738 | 13.0% |