Dominican Married-couple Households
COMPARE
Dominican
Select to Compare
Married-couple Households
Dominican Married-couple Households
38.2%
MARRIED-COUPLE HOUSEHOLDS
0.0/ 100
METRIC RATING
340th/ 347
METRIC RANK
Dominican Married-couple Households Correlation Chart
The statistical analysis conducted on geographies consisting of 354,744,310 people shows a moderate negative correlation between the proportion of Dominicans and percentage of married-couple family households in the United States with a correlation coefficient (R) of -0.437 and weighted average of 38.2%. On average, for every 1% (one percent) increase in Dominicans within a typical geography, there is a decrease of 0.25% in percentage of married-couple family households.
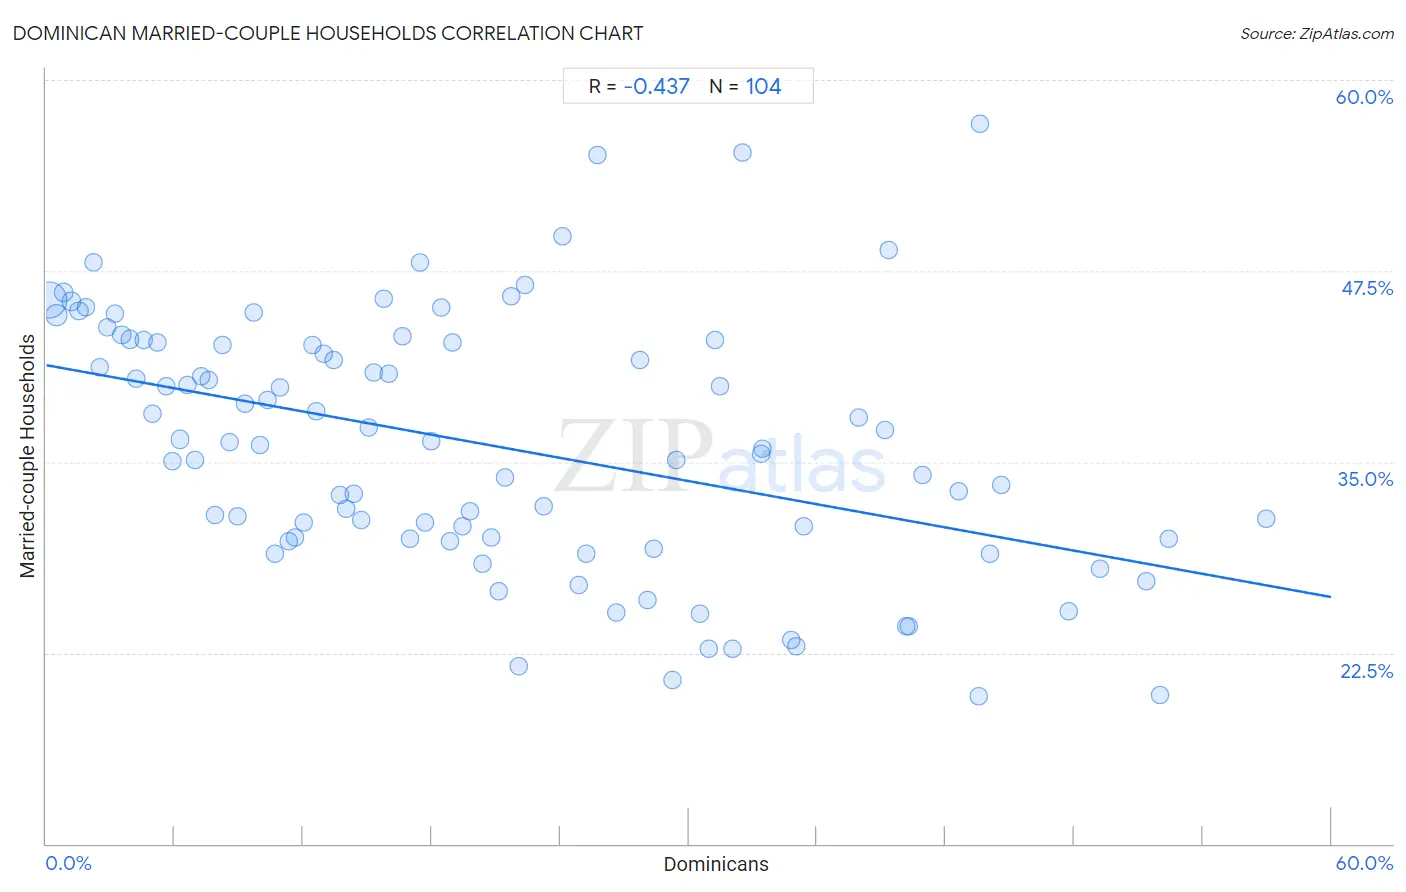
It is essential to understand that the correlation between the percentage of Dominicans and percentage of married-couple family households does not imply a direct cause-and-effect relationship. It remains uncertain whether the presence of Dominicans influences an upward or downward trend in the level of percentage of married-couple family households within an area, or if Dominicans simply ended up residing in those areas with higher or lower levels of percentage of married-couple family households due to other factors.
Demographics Similar to Dominicans by Married-couple Households
In terms of married-couple households, the demographic groups most similar to Dominicans are Cape Verdean (38.1%, a difference of 0.13%), British West Indian (38.3%, a difference of 0.38%), Immigrants from Senegal (38.4%, a difference of 0.50%), Immigrants from Somalia (38.4%, a difference of 0.66%), and Tohono O'odham (37.9%, a difference of 0.73%).
| Demographics | Rating | Rank | Married-couple Households |
| Immigrants from West Indies | 0.0 /100 | #333 | Tragic 39.0% |
| Immigrants from St. Vincent and the Grenadines | 0.0 /100 | #334 | Tragic 38.7% |
| Senegalese | 0.0 /100 | #335 | Tragic 38.6% |
| Blacks/African Americans | 0.0 /100 | #336 | Tragic 38.5% |
| Immigrants from Somalia | 0.0 /100 | #337 | Tragic 38.4% |
| Immigrants from Senegal | 0.0 /100 | #338 | Tragic 38.4% |
| British West Indians | 0.0 /100 | #339 | Tragic 38.3% |
| Dominicans | 0.0 /100 | #340 | Tragic 38.2% |
| Cape Verdeans | 0.0 /100 | #341 | Tragic 38.1% |
| Tohono O'odham | 0.0 /100 | #342 | Tragic 37.9% |
| Immigrants from Grenada | 0.0 /100 | #343 | Tragic 37.5% |
| Immigrants from Dominican Republic | 0.0 /100 | #344 | Tragic 37.3% |
| Hopi | 0.0 /100 | #345 | Tragic 36.7% |
| Immigrants from Cabo Verde | 0.0 /100 | #346 | Tragic 36.2% |
| Pima | 0.0 /100 | #347 | Tragic 35.6% |
Dominican Married-couple Households Correlation Summary
| Measurement | Dominican Data | Married-couple Households Data |
| Minimum | 0.11% | 19.7% |
| Maximum | 57.0% | 57.1% |
| Range | 56.9% | 37.4% |
| Mean | 20.6% | 36.1% |
| Median | 17.8% | 36.2% |
| Interquartile 25% (IQ1) | 8.7% | 30.0% |
| Interquartile 75% (IQ3) | 31.1% | 42.8% |
| Interquartile Range (IQR) | 22.4% | 12.8% |
| Standard Deviation (Sample) | 14.4% | 8.3% |
| Standard Deviation (Population) | 14.3% | 8.3% |
Correlation Details
| Dominican Percentile | Sample Size | Married-couple Households |
[ 0.0% - 0.5% ] 0.11% | 221,581,584 | 45.6% |
[ 0.0% - 0.5% ] 0.48% | 41,191,188 | 44.6% |
[ 0.5% - 1.0% ] 0.83% | 16,259,315 | 46.1% |
[ 1.0% - 1.5% ] 1.17% | 11,583,749 | 45.5% |
[ 1.5% - 2.0% ] 1.52% | 8,960,782 | 44.9% |
[ 1.5% - 2.0% ] 1.84% | 6,703,911 | 45.1% |
[ 2.0% - 2.5% ] 2.19% | 4,131,468 | 48.1% |
[ 2.5% - 3.0% ] 2.50% | 6,606,031 | 41.2% |
[ 2.5% - 3.0% ] 2.86% | 3,704,676 | 43.8% |
[ 3.0% - 3.5% ] 3.22% | 2,682,658 | 44.7% |
[ 3.5% - 4.0% ] 3.53% | 2,899,714 | 43.3% |
[ 3.5% - 4.0% ] 3.89% | 1,549,523 | 43.0% |
[ 4.0% - 4.5% ] 4.23% | 1,300,930 | 40.4% |
[ 4.5% - 5.0% ] 4.56% | 922,557 | 43.0% |
[ 4.5% - 5.0% ] 4.93% | 893,585 | 38.2% |
[ 5.0% - 5.5% ] 5.21% | 950,750 | 42.8% |
[ 5.5% - 6.0% ] 5.58% | 915,480 | 39.9% |
[ 5.5% - 6.0% ] 5.88% | 1,413,677 | 35.1% |
[ 6.0% - 6.5% ] 6.25% | 529,220 | 36.5% |
[ 6.5% - 7.0% ] 6.61% | 930,637 | 40.0% |
[ 6.5% - 7.0% ] 6.94% | 1,042,526 | 35.2% |
[ 7.0% - 7.5% ] 7.22% | 422,097 | 40.6% |
[ 7.5% - 8.0% ] 7.60% | 492,685 | 40.4% |
[ 7.5% - 8.0% ] 7.89% | 523,864 | 31.5% |
[ 8.0% - 8.5% ] 8.23% | 131,957 | 42.6% |
[ 8.5% - 9.0% ] 8.55% | 8,680,543 | 36.3% |
[ 8.5% - 9.0% ] 8.92% | 147,272 | 31.5% |
[ 9.0% - 9.5% ] 9.26% | 476,935 | 38.8% |
[ 9.5% - 10.0% ] 9.67% | 231,834 | 44.8% |
[ 10.0% - 10.5% ] 10.01% | 218,255 | 36.1% |
[ 10.0% - 10.5% ] 10.35% | 458,644 | 39.1% |
[ 10.5% - 11.0% ] 10.66% | 389,731 | 29.0% |
[ 10.5% - 11.0% ] 10.93% | 143,937 | 39.9% |
[ 11.0% - 11.5% ] 11.30% | 222,335 | 29.8% |
[ 11.5% - 12.0% ] 11.62% | 160,016 | 30.0% |
[ 12.0% - 12.5% ] 12.01% | 179,045 | 31.1% |
[ 12.0% - 12.5% ] 12.44% | 29,784 | 42.6% |
[ 12.5% - 13.0% ] 12.60% | 30,253 | 38.3% |
[ 12.5% - 13.0% ] 12.95% | 148,617 | 42.1% |
[ 13.0% - 13.5% ] 13.40% | 187,039 | 41.7% |
[ 13.5% - 14.0% ] 13.69% | 59,864 | 32.8% |
[ 14.0% - 14.5% ] 14.03% | 241,511 | 32.0% |
[ 14.0% - 14.5% ] 14.34% | 21,420 | 32.9% |
[ 14.5% - 15.0% ] 14.70% | 119,137 | 31.2% |
[ 15.0% - 15.5% ] 15.05% | 261,271 | 37.3% |
[ 15.0% - 15.5% ] 15.30% | 254,656 | 40.9% |
[ 15.5% - 16.0% ] 15.73% | 67,652 | 45.7% |
[ 15.5% - 16.0% ] 15.99% | 177,725 | 40.8% |
[ 16.5% - 17.0% ] 16.66% | 178,216 | 43.3% |
[ 17.0% - 17.5% ] 17.01% | 194,109 | 30.0% |
[ 17.0% - 17.5% ] 17.46% | 47,816 | 48.0% |
[ 17.5% - 18.0% ] 17.70% | 119,580 | 31.0% |
[ 17.5% - 18.0% ] 17.99% | 136,680 | 36.3% |
[ 18.0% - 18.5% ] 18.43% | 28,315 | 45.1% |
[ 18.5% - 19.0% ] 18.83% | 115,936 | 29.8% |
[ 18.5% - 19.0% ] 18.98% | 26,322 | 42.8% |
[ 19.0% - 19.5% ] 19.41% | 79,714 | 30.8% |
[ 19.5% - 20.0% ] 19.78% | 87,444 | 31.7% |
[ 20.0% - 20.5% ] 20.37% | 130,234 | 28.4% |
[ 20.5% - 21.0% ] 20.79% | 190,580 | 30.1% |
[ 21.0% - 21.5% ] 21.15% | 125,036 | 26.5% |
[ 21.0% - 21.5% ] 21.42% | 73,231 | 34.0% |
[ 21.5% - 22.0% ] 21.74% | 69 | 45.8% |
[ 22.0% - 22.5% ] 22.04% | 11,280 | 21.6% |
[ 22.0% - 22.5% ] 22.35% | 10,649 | 46.6% |
[ 23.0% - 23.5% ] 23.22% | 191,407 | 32.1% |
[ 24.0% - 24.5% ] 24.10% | 2,332 | 49.8% |
[ 24.5% - 25.0% ] 24.86% | 95,009 | 27.0% |
[ 25.0% - 25.5% ] 25.20% | 14,865 | 29.0% |
[ 25.5% - 26.0% ] 25.76% | 198 | 55.1% |
[ 26.5% - 27.0% ] 26.59% | 151,471 | 25.1% |
[ 27.5% - 28.0% ] 27.71% | 2,021 | 41.7% |
[ 28.0% - 28.5% ] 28.06% | 56,702 | 26.0% |
[ 28.0% - 28.5% ] 28.39% | 701 | 29.3% |
[ 29.0% - 29.5% ] 29.27% | 59,852 | 20.7% |
[ 29.0% - 29.5% ] 29.40% | 160,705 | 35.1% |
[ 30.0% - 30.5% ] 30.50% | 61,044 | 25.1% |
[ 30.5% - 31.0% ] 30.95% | 79,817 | 22.8% |
[ 31.0% - 31.5% ] 31.23% | 24,893 | 43.0% |
[ 31.0% - 31.5% ] 31.45% | 11,069 | 40.0% |
[ 32.0% - 32.5% ] 32.02% | 11,939 | 22.8% |
[ 32.0% - 32.5% ] 32.49% | 237 | 55.2% |
[ 33.0% - 33.5% ] 33.36% | 25,674 | 35.5% |
[ 33.0% - 33.5% ] 33.45% | 16,149 | 35.9% |
[ 34.5% - 35.0% ] 34.77% | 82,678 | 23.3% |
[ 35.0% - 35.5% ] 35.00% | 78,624 | 22.9% |
[ 35.0% - 35.5% ] 35.36% | 49,273 | 30.8% |
[ 37.5% - 38.0% ] 37.93% | 18,461 | 37.9% |
[ 39.0% - 39.5% ] 39.15% | 58,136 | 37.1% |
[ 39.0% - 39.5% ] 39.36% | 6,252 | 48.8% |
[ 40.0% - 40.5% ] 40.17% | 697 | 24.2% |
[ 40.0% - 40.5% ] 40.29% | 111,904 | 24.3% |
[ 40.5% - 41.0% ] 40.92% | 55,226 | 34.2% |
[ 42.5% - 43.0% ] 42.60% | 34,801 | 33.0% |
[ 43.5% - 44.0% ] 43.57% | 60,480 | 19.7% |
[ 43.5% - 44.0% ] 43.59% | 117 | 57.1% |
[ 44.0% - 44.5% ] 44.09% | 87,063 | 29.0% |
[ 44.5% - 45.0% ] 44.59% | 32,860 | 33.5% |
[ 47.5% - 48.0% ] 47.73% | 81,397 | 25.2% |
[ 49.0% - 49.5% ] 49.23% | 41,570 | 28.0% |
[ 51.0% - 51.5% ] 51.35% | 43,653 | 27.1% |
[ 51.5% - 52.0% ] 52.00% | 6,977 | 19.7% |
[ 52.0% - 52.5% ] 52.39% | 88,067 | 30.0% |
[ 56.5% - 57.0% ] 56.99% | 52,738 | 31.2% |