Burmese 2 or more Vehicles in Household
COMPARE
Burmese
Select to Compare
2 or more Vehicles in Household
Burmese 2 or more Vehicles in Household
57.8%
2+ VEHICLES AVAILABLE
98.8/ 100
METRIC RATING
96th/ 347
METRIC RANK
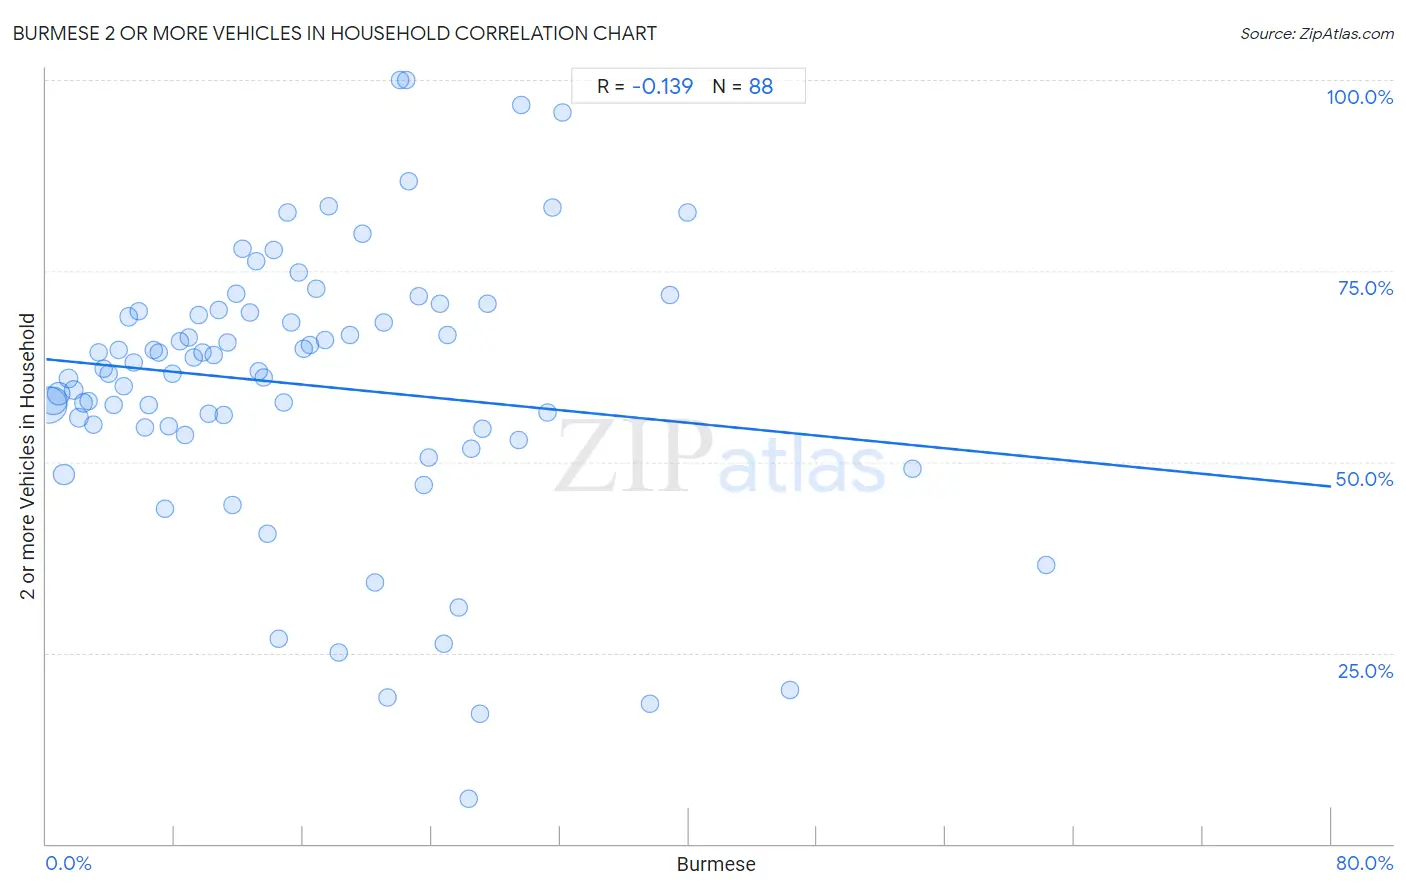
Burmese 2 or more Vehicles in Household Correlation Chart
The statistical analysis conducted on geographies consisting of 464,950,170 people shows a poor negative correlation between the proportion of Burmese and percentage of households with 2 or more vehicles available in the United States with a correlation coefficient (R) of -0.139 and weighted average of 57.8%. On average, for every 1% (one percent) increase in Burmese within a typical geography, there is a decrease of 0.21% in percentage of households with 2 or more vehicles available.
It is essential to understand that the correlation between the percentage of Burmese and percentage of households with 2 or more vehicles available does not imply a direct cause-and-effect relationship. It remains uncertain whether the presence of Burmese influences an upward or downward trend in the level of percentage of households with 2 or more vehicles available within an area, or if Burmese simply ended up residing in those areas with higher or lower levels of percentage of households with 2 or more vehicles available due to other factors.
Demographics Similar to Burmese by 2 or more Vehicles in Household
In terms of 2 or more vehicles in household, the demographic groups most similar to Burmese are Slavic (57.8%, a difference of 0.020%), Hmong (57.8%, a difference of 0.030%), Filipino (57.8%, a difference of 0.060%), Shoshone (57.9%, a difference of 0.12%), and Ottawa (57.9%, a difference of 0.12%).
| Demographics | Rating | Rank | 2 or more Vehicles in Household |
| Immigrants from Germany | 99.0 /100 | #89 | Exceptional 57.9% |
| Hispanics or Latinos | 99.0 /100 | #90 | Exceptional 57.9% |
| Pakistanis | 99.0 /100 | #91 | Exceptional 57.9% |
| Shoshone | 99.0 /100 | #92 | Exceptional 57.9% |
| Ottawa | 99.0 /100 | #93 | Exceptional 57.9% |
| Filipinos | 98.9 /100 | #94 | Exceptional 57.8% |
| Hmong | 98.9 /100 | #95 | Exceptional 57.8% |
| Burmese | 98.8 /100 | #96 | Exceptional 57.8% |
| Slavs | 98.8 /100 | #97 | Exceptional 57.8% |
| Palestinians | 98.6 /100 | #98 | Exceptional 57.7% |
| Cajuns | 98.5 /100 | #99 | Exceptional 57.7% |
| Fijians | 98.4 /100 | #100 | Exceptional 57.6% |
| Lebanese | 98.3 /100 | #101 | Exceptional 57.6% |
| Immigrants from Bolivia | 98.2 /100 | #102 | Exceptional 57.6% |
| Jordanians | 98.2 /100 | #103 | Exceptional 57.6% |
Burmese 2 or more Vehicles in Household Correlation Summary
| Measurement | Burmese Data | 2 or more Vehicles in Household Data |
| Minimum | 0.15% | 5.9% |
| Maximum | 62.3% | 100.0% |
| Range | 62.1% | 94.1% |
| Mean | 16.1% | 60.1% |
| Median | 13.7% | 62.0% |
| Interquartile 25% (IQ1) | 6.9% | 54.5% |
| Interquartile 75% (IQ3) | 23.4% | 69.7% |
| Interquartile Range (IQR) | 16.5% | 15.2% |
| Standard Deviation (Sample) | 12.2% | 18.3% |
| Standard Deviation (Population) | 12.1% | 18.2% |
Correlation Details
| Burmese Percentile | Sample Size | 2 or more Vehicles in Household |
[ 0.0% - 0.5% ] 0.15% | 193,533,929 | 57.4% |
[ 0.0% - 0.5% ] 0.45% | 110,965,080 | 58.0% |
[ 0.5% - 1.0% ] 0.76% | 52,510,473 | 59.0% |
[ 1.0% - 1.5% ] 1.07% | 35,024,054 | 48.3% |
[ 1.0% - 1.5% ] 1.39% | 17,679,275 | 60.9% |
[ 1.5% - 2.0% ] 1.70% | 13,801,255 | 59.4% |
[ 2.0% - 2.5% ] 2.02% | 8,492,079 | 55.8% |
[ 2.0% - 2.5% ] 2.32% | 5,482,339 | 57.7% |
[ 2.5% - 3.0% ] 2.63% | 3,865,308 | 57.9% |
[ 2.5% - 3.0% ] 2.94% | 7,191,058 | 54.9% |
[ 3.0% - 3.5% ] 3.28% | 2,340,240 | 64.3% |
[ 3.5% - 4.0% ] 3.60% | 1,784,113 | 62.1% |
[ 3.5% - 4.0% ] 3.89% | 1,533,677 | 61.6% |
[ 4.0% - 4.5% ] 4.20% | 1,244,661 | 57.4% |
[ 4.5% - 5.0% ] 4.50% | 1,060,066 | 64.7% |
[ 4.5% - 5.0% ] 4.83% | 647,634 | 59.9% |
[ 5.0% - 5.5% ] 5.17% | 986,386 | 69.0% |
[ 5.0% - 5.5% ] 5.43% | 802,879 | 63.0% |
[ 5.5% - 6.0% ] 5.74% | 308,250 | 69.8% |
[ 6.0% - 6.5% ] 6.11% | 788,571 | 54.6% |
[ 6.0% - 6.5% ] 6.37% | 338,337 | 57.4% |
[ 6.5% - 7.0% ] 6.73% | 242,654 | 64.6% |
[ 6.5% - 7.0% ] 6.99% | 240,201 | 64.3% |
[ 7.0% - 7.5% ] 7.38% | 248,208 | 43.9% |
[ 7.5% - 8.0% ] 7.66% | 133,071 | 54.7% |
[ 7.5% - 8.0% ] 7.87% | 478,031 | 61.6% |
[ 8.0% - 8.5% ] 8.33% | 94,732 | 65.7% |
[ 8.5% - 9.0% ] 8.61% | 135,344 | 53.6% |
[ 8.5% - 9.0% ] 8.87% | 266,988 | 66.2% |
[ 9.0% - 9.5% ] 9.19% | 100,762 | 63.7% |
[ 9.5% - 10.0% ] 9.52% | 146,386 | 69.2% |
[ 9.5% - 10.0% ] 9.75% | 132,937 | 64.3% |
[ 10.0% - 10.5% ] 10.11% | 119,966 | 56.2% |
[ 10.0% - 10.5% ] 10.47% | 35,982 | 64.0% |
[ 10.5% - 11.0% ] 10.77% | 213,237 | 69.9% |
[ 11.0% - 11.5% ] 11.03% | 282,578 | 56.1% |
[ 11.0% - 11.5% ] 11.27% | 42,228 | 65.7% |
[ 11.5% - 12.0% ] 11.58% | 59,410 | 44.4% |
[ 11.5% - 12.0% ] 11.85% | 51,367 | 72.0% |
[ 12.0% - 12.5% ] 12.22% | 27,774 | 77.8% |
[ 12.5% - 13.0% ] 12.68% | 258,950 | 69.6% |
[ 13.0% - 13.5% ] 13.04% | 49,955 | 76.3% |
[ 13.0% - 13.5% ] 13.19% | 234,383 | 61.8% |
[ 13.5% - 14.0% ] 13.57% | 72,955 | 61.1% |
[ 13.5% - 14.0% ] 13.81% | 94,563 | 40.7% |
[ 14.0% - 14.5% ] 14.13% | 92 | 77.8% |
[ 14.0% - 14.5% ] 14.44% | 22,723 | 26.9% |
[ 14.5% - 15.0% ] 14.80% | 153,129 | 57.8% |
[ 15.0% - 15.5% ] 15.04% | 50,419 | 82.6% |
[ 15.0% - 15.5% ] 15.28% | 746 | 68.2% |
[ 15.5% - 16.0% ] 15.71% | 26,355 | 74.8% |
[ 16.0% - 16.5% ] 16.02% | 24,044 | 64.8% |
[ 16.0% - 16.5% ] 16.41% | 20,578 | 65.3% |
[ 16.5% - 17.0% ] 16.79% | 32,737 | 72.7% |
[ 17.0% - 17.5% ] 17.38% | 30,685 | 66.0% |
[ 17.5% - 18.0% ] 17.58% | 5,552 | 83.4% |
[ 18.0% - 18.5% ] 18.18% | 44 | 25.0% |
[ 18.5% - 19.0% ] 18.92% | 37 | 66.7% |
[ 19.5% - 20.0% ] 19.71% | 10,694 | 79.9% |
[ 20.0% - 20.5% ] 20.45% | 28,984 | 34.2% |
[ 21.0% - 21.5% ] 21.01% | 39,049 | 68.3% |
[ 21.0% - 21.5% ] 21.28% | 141 | 19.2% |
[ 22.0% - 22.5% ] 22.02% | 109 | 100.0% |
[ 22.0% - 22.5% ] 22.41% | 116 | 100.0% |
[ 22.5% - 23.0% ] 22.58% | 62 | 86.7% |
[ 23.0% - 23.5% ] 23.22% | 23,546 | 71.7% |
[ 23.0% - 23.5% ] 23.48% | 133,518 | 46.9% |
[ 23.5% - 24.0% ] 23.80% | 22,930 | 50.5% |
[ 24.5% - 25.0% ] 24.51% | 17,110 | 70.8% |
[ 24.5% - 25.0% ] 24.71% | 37,754 | 26.2% |
[ 25.0% - 25.5% ] 25.00% | 88 | 66.7% |
[ 25.5% - 26.0% ] 25.72% | 43,169 | 30.9% |
[ 26.0% - 26.5% ] 26.32% | 38 | 5.9% |
[ 26.0% - 26.5% ] 26.49% | 385 | 51.7% |
[ 27.0% - 27.5% ] 27.03% | 111 | 17.0% |
[ 27.0% - 27.5% ] 27.19% | 18,564 | 54.4% |
[ 27.0% - 27.5% ] 27.45% | 11,314 | 70.7% |
[ 29.0% - 29.5% ] 29.41% | 34 | 52.9% |
[ 29.5% - 30.0% ] 29.61% | 689 | 96.7% |
[ 31.0% - 31.5% ] 31.17% | 324 | 56.4% |
[ 31.5% - 32.0% ] 31.55% | 5,863 | 83.3% |
[ 32.0% - 32.5% ] 32.14% | 280 | 95.8% |
[ 37.5% - 38.0% ] 37.60% | 125 | 18.3% |
[ 38.5% - 39.0% ] 38.87% | 602 | 71.8% |
[ 39.5% - 40.0% ] 39.89% | 351 | 82.7% |
[ 46.0% - 46.5% ] 46.33% | 4,185 | 20.2% |
[ 53.5% - 54.0% ] 53.89% | 40,462 | 49.1% |
[ 62.0% - 62.5% ] 62.26% | 106 | 36.5% |