American Wage/Income Gap
COMPARE
American
Select to Compare
Wage/Income Gap
American Wage/Income Gap
27.8%
WAGE/INCOME GAP
0.7/ 100
METRIC RATING
274th/ 347
METRIC RANK
American Wage/Income Gap Correlation Chart
The statistical analysis conducted on geographies consisting of 577,977,110 people shows a weak positive correlation between the proportion of Americans and wage/income gap percentage in the United States with a correlation coefficient (R) of 0.262 and weighted average of 27.8%. On average, for every 1% (one percent) increase in Americans within a typical geography, there is an increase of 0.12% in wage/income gap percentage.
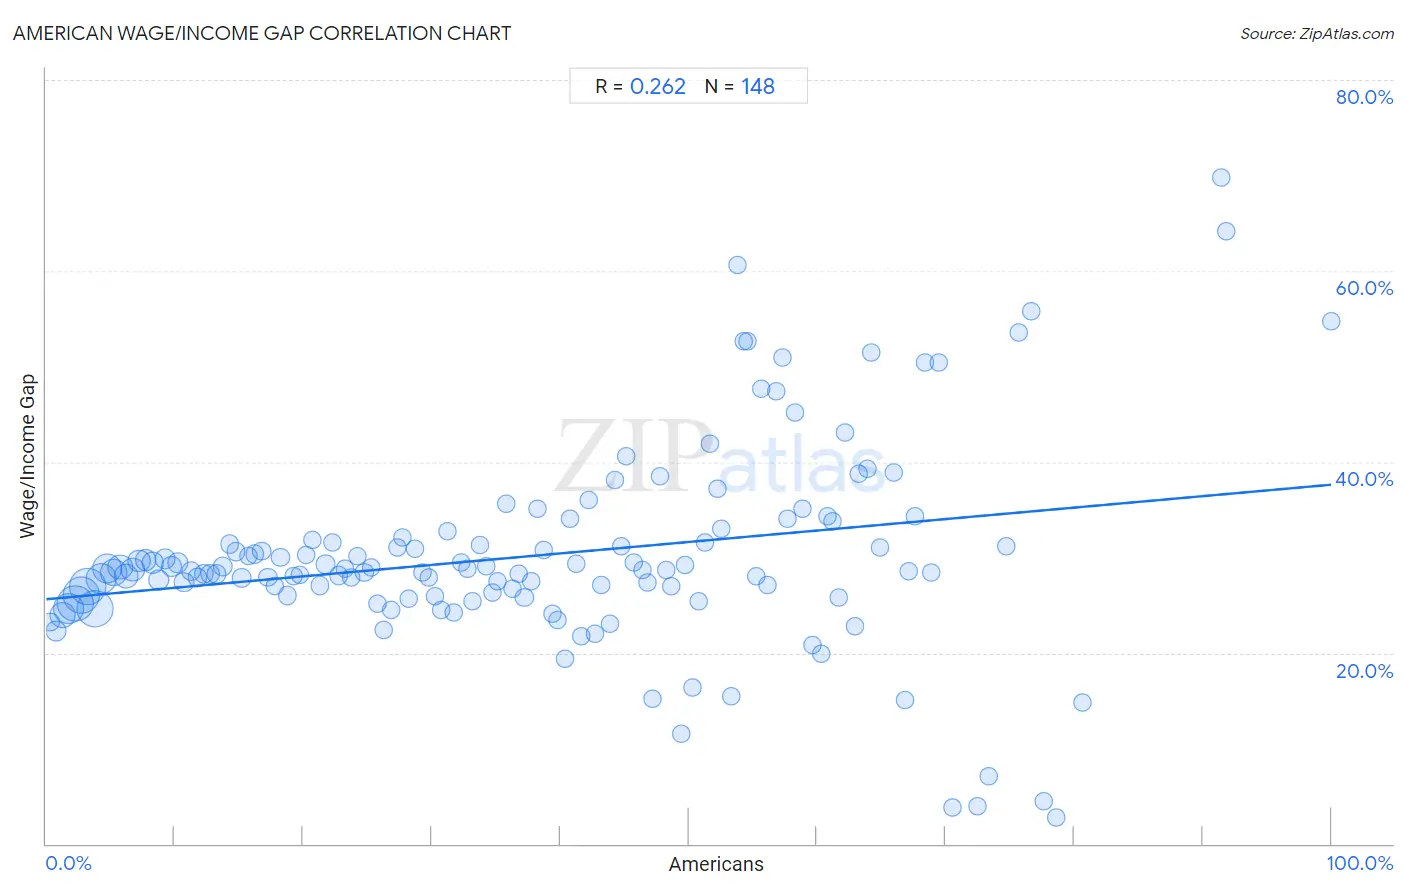
It is essential to understand that the correlation between the percentage of Americans and wage/income gap percentage does not imply a direct cause-and-effect relationship. It remains uncertain whether the presence of Americans influences an upward or downward trend in the level of wage/income gap percentage within an area, or if Americans simply ended up residing in those areas with higher or lower levels of wage/income gap percentage due to other factors.
Demographics Similar to Americans by Wage/Income Gap
In terms of wage/income gap, the demographic groups most similar to Americans are Bulgarian (27.8%, a difference of 0.040%), Immigrants from Japan (27.9%, a difference of 0.080%), Lebanese (27.9%, a difference of 0.11%), Latvian (27.9%, a difference of 0.11%), and Immigrants from Korea (27.8%, a difference of 0.15%).
| Demographics | Rating | Rank | Wage/Income Gap |
| Turks | 1.0 /100 | #267 | Tragic 27.7% |
| New Zealanders | 1.0 /100 | #268 | Tragic 27.7% |
| Potawatomi | 0.9 /100 | #269 | Tragic 27.7% |
| Immigrants from Western Europe | 0.9 /100 | #270 | Tragic 27.8% |
| Ute | 0.8 /100 | #271 | Tragic 27.8% |
| Immigrants from Korea | 0.8 /100 | #272 | Tragic 27.8% |
| Bulgarians | 0.7 /100 | #273 | Tragic 27.8% |
| Americans | 0.7 /100 | #274 | Tragic 27.8% |
| Immigrants from Japan | 0.7 /100 | #275 | Tragic 27.9% |
| Lebanese | 0.7 /100 | #276 | Tragic 27.9% |
| Latvians | 0.7 /100 | #277 | Tragic 27.9% |
| Immigrants from England | 0.6 /100 | #278 | Tragic 27.9% |
| Romanians | 0.5 /100 | #279 | Tragic 28.0% |
| Russians | 0.5 /100 | #280 | Tragic 28.0% |
| Burmese | 0.5 /100 | #281 | Tragic 28.0% |
American Wage/Income Gap Correlation Summary
| Measurement | American Data | Wage/Income Gap Data |
| Minimum | 0.33% | 2.7% |
| Maximum | 100.0% | 69.8% |
| Range | 99.7% | 67.1% |
| Mean | 37.9% | 30.2% |
| Median | 37.0% | 28.7% |
| Interquartile 25% (IQ1) | 18.5% | 26.0% |
| Interquartile 75% (IQ3) | 55.5% | 31.7% |
| Interquartile Range (IQR) | 37.0% | 5.7% |
| Standard Deviation (Sample) | 23.0% | 10.5% |
| Standard Deviation (Population) | 22.9% | 10.5% |
Correlation Details
| American Percentile | Sample Size | Wage/Income Gap |
[ 0.0% - 0.5% ] 0.33% | 2,800,301 | 23.2% |
[ 0.5% - 1.0% ] 0.79% | 9,143,007 | 22.3% |
[ 1.0% - 1.5% ] 1.28% | 22,496,505 | 23.9% |
[ 1.5% - 2.0% ] 1.76% | 39,669,268 | 24.6% |
[ 2.0% - 2.5% ] 2.26% | 56,269,391 | 25.2% |
[ 2.5% - 3.0% ] 2.75% | 57,405,102 | 26.0% |
[ 3.0% - 3.5% ] 3.24% | 56,471,939 | 26.9% |
[ 3.5% - 4.0% ] 3.75% | 57,919,157 | 24.7% |
[ 4.0% - 4.5% ] 4.25% | 39,090,736 | 27.8% |
[ 4.5% - 5.0% ] 4.74% | 36,784,419 | 28.8% |
[ 5.0% - 5.5% ] 5.25% | 27,295,022 | 28.5% |
[ 5.5% - 6.0% ] 5.76% | 21,681,378 | 29.0% |
[ 6.0% - 6.5% ] 6.24% | 20,099,389 | 28.0% |
[ 6.5% - 7.0% ] 6.75% | 17,643,007 | 28.7% |
[ 7.0% - 7.5% ] 7.24% | 13,172,341 | 29.6% |
[ 7.5% - 8.0% ] 7.74% | 11,205,899 | 29.7% |
[ 8.0% - 8.5% ] 8.26% | 10,099,466 | 29.5% |
[ 8.5% - 9.0% ] 8.74% | 7,842,054 | 27.6% |
[ 9.0% - 9.5% ] 9.25% | 7,209,108 | 29.9% |
[ 9.5% - 10.0% ] 9.74% | 6,179,203 | 29.1% |
[ 10.0% - 10.5% ] 10.24% | 5,894,724 | 29.4% |
[ 10.5% - 11.0% ] 10.73% | 5,612,973 | 27.4% |
[ 11.0% - 11.5% ] 11.24% | 4,721,179 | 28.5% |
[ 11.5% - 12.0% ] 11.72% | 4,161,724 | 27.9% |
[ 12.0% - 12.5% ] 12.24% | 3,365,934 | 28.3% |
[ 12.5% - 13.0% ] 12.73% | 3,220,371 | 28.2% |
[ 13.0% - 13.5% ] 13.24% | 2,423,170 | 28.3% |
[ 13.5% - 14.0% ] 13.75% | 2,160,912 | 29.0% |
[ 14.0% - 14.5% ] 14.27% | 1,972,158 | 31.4% |
[ 14.5% - 15.0% ] 14.76% | 1,725,855 | 30.6% |
[ 15.0% - 15.5% ] 15.21% | 1,499,167 | 27.8% |
[ 15.5% - 16.0% ] 15.76% | 1,791,930 | 30.2% |
[ 16.0% - 16.5% ] 16.25% | 1,539,808 | 30.4% |
[ 16.5% - 17.0% ] 16.77% | 1,154,039 | 30.7% |
[ 17.0% - 17.5% ] 17.23% | 1,471,011 | 27.9% |
[ 17.5% - 18.0% ] 17.76% | 1,372,040 | 27.0% |
[ 18.0% - 18.5% ] 18.22% | 940,394 | 30.0% |
[ 18.5% - 19.0% ] 18.75% | 759,780 | 26.0% |
[ 19.0% - 19.5% ] 19.23% | 814,206 | 28.0% |
[ 19.5% - 20.0% ] 19.77% | 921,822 | 28.2% |
[ 20.0% - 20.5% ] 20.24% | 586,166 | 30.3% |
[ 20.5% - 21.0% ] 20.73% | 497,473 | 31.9% |
[ 21.0% - 21.5% ] 21.29% | 671,405 | 27.0% |
[ 21.5% - 22.0% ] 21.74% | 547,279 | 29.3% |
[ 22.0% - 22.5% ] 22.23% | 342,386 | 31.5% |
[ 22.5% - 23.0% ] 22.75% | 606,905 | 28.1% |
[ 23.0% - 23.5% ] 23.28% | 380,031 | 28.8% |
[ 23.5% - 24.0% ] 23.75% | 407,719 | 27.9% |
[ 24.0% - 24.5% ] 24.26% | 448,475 | 30.2% |
[ 24.5% - 25.0% ] 24.76% | 287,032 | 28.4% |
[ 25.0% - 25.5% ] 25.26% | 275,786 | 28.9% |
[ 25.5% - 26.0% ] 25.74% | 282,284 | 25.1% |
[ 26.0% - 26.5% ] 26.24% | 268,135 | 22.4% |
[ 26.5% - 27.0% ] 26.85% | 516,229 | 24.4% |
[ 27.0% - 27.5% ] 27.30% | 254,324 | 31.0% |
[ 27.5% - 28.0% ] 27.74% | 262,070 | 32.0% |
[ 28.0% - 28.5% ] 28.23% | 250,388 | 25.6% |
[ 28.5% - 29.0% ] 28.71% | 138,925 | 30.9% |
[ 29.0% - 29.5% ] 29.25% | 234,232 | 28.4% |
[ 29.5% - 30.0% ] 29.73% | 176,790 | 27.8% |
[ 30.0% - 30.5% ] 30.28% | 113,680 | 26.0% |
[ 30.5% - 31.0% ] 30.75% | 253,248 | 24.5% |
[ 31.0% - 31.5% ] 31.24% | 117,193 | 32.8% |
[ 31.5% - 32.0% ] 31.72% | 73,977 | 24.2% |
[ 32.0% - 32.5% ] 32.25% | 241,395 | 29.5% |
[ 32.5% - 33.0% ] 32.76% | 104,474 | 28.8% |
[ 33.0% - 33.5% ] 33.20% | 98,628 | 25.4% |
[ 33.5% - 34.0% ] 33.72% | 80,156 | 31.3% |
[ 34.0% - 34.5% ] 34.21% | 44,958 | 29.0% |
[ 34.5% - 35.0% ] 34.75% | 93,777 | 26.3% |
[ 35.0% - 35.5% ] 35.16% | 53,346 | 27.4% |
[ 35.5% - 36.0% ] 35.77% | 115,627 | 35.6% |
[ 36.0% - 36.5% ] 36.27% | 125,432 | 26.7% |
[ 36.5% - 37.0% ] 36.80% | 53,703 | 28.3% |
[ 37.0% - 37.5% ] 37.21% | 61,181 | 25.8% |
[ 37.5% - 38.0% ] 37.71% | 88,774 | 27.5% |
[ 38.0% - 38.5% ] 38.23% | 37,949 | 35.1% |
[ 38.5% - 39.0% ] 38.72% | 40,677 | 30.8% |
[ 39.0% - 39.5% ] 39.36% | 71,252 | 24.1% |
[ 39.5% - 40.0% ] 39.79% | 52,712 | 23.4% |
[ 40.0% - 40.5% ] 40.35% | 21,267 | 19.4% |
[ 40.5% - 41.0% ] 40.79% | 28,359 | 34.0% |
[ 41.0% - 41.5% ] 41.28% | 38,383 | 29.3% |
[ 41.5% - 42.0% ] 41.66% | 29,986 | 21.7% |
[ 42.0% - 42.5% ] 42.25% | 24,613 | 36.0% |
[ 42.5% - 43.0% ] 42.74% | 16,510 | 22.0% |
[ 43.0% - 43.5% ] 43.22% | 50,792 | 27.1% |
[ 43.5% - 44.0% ] 43.88% | 37,959 | 23.0% |
[ 44.0% - 44.5% ] 44.25% | 15,258 | 38.1% |
[ 44.5% - 45.0% ] 44.76% | 33,645 | 31.1% |
[ 45.0% - 45.5% ] 45.18% | 10,244 | 40.6% |
[ 45.5% - 46.0% ] 45.74% | 24,135 | 29.5% |
[ 46.0% - 46.5% ] 46.37% | 9,462 | 28.7% |
[ 46.5% - 47.0% ] 46.81% | 3,249 | 27.4% |
[ 47.0% - 47.5% ] 47.15% | 29,502 | 15.2% |
[ 47.5% - 48.0% ] 47.74% | 9,756 | 38.4% |
[ 48.0% - 48.5% ] 48.25% | 20,759 | 28.7% |
[ 48.5% - 49.0% ] 48.66% | 6,428 | 27.0% |
[ 49.0% - 49.5% ] 49.37% | 15,921 | 11.5% |
[ 49.5% - 50.0% ] 49.70% | 14,963 | 29.2% |
[ 50.0% - 50.5% ] 50.31% | 20,818 | 16.4% |
[ 50.5% - 51.0% ] 50.79% | 3,554 | 25.4% |
[ 51.0% - 51.5% ] 51.31% | 5,857 | 31.6% |
[ 51.5% - 52.0% ] 51.66% | 12,612 | 41.8% |
[ 52.0% - 52.5% ] 52.22% | 10,669 | 37.2% |
[ 52.5% - 53.0% ] 52.56% | 16,868 | 33.0% |
[ 53.0% - 53.5% ] 53.31% | 14,177 | 15.4% |
[ 53.5% - 54.0% ] 53.81% | 1,353 | 60.7% |
[ 54.0% - 54.5% ] 54.29% | 1,072 | 52.6% |
[ 54.5% - 55.0% ] 54.57% | 8,439 | 52.6% |
[ 55.0% - 55.5% ] 55.22% | 1,543 | 28.0% |
[ 55.5% - 56.0% ] 55.69% | 2,972 | 47.7% |
[ 56.0% - 56.5% ] 56.12% | 8,411 | 27.1% |
[ 56.5% - 57.0% ] 56.80% | 17,258 | 47.4% |
[ 57.0% - 57.5% ] 57.28% | 810 | 50.9% |
[ 57.5% - 58.0% ] 57.72% | 868 | 34.0% |
[ 58.0% - 58.5% ] 58.22% | 955 | 45.2% |
[ 58.5% - 59.0% ] 58.83% | 6,903 | 35.1% |
[ 59.5% - 60.0% ] 59.61% | 1,983 | 20.8% |
[ 60.0% - 60.5% ] 60.28% | 3,988 | 19.9% |
[ 60.5% - 61.0% ] 60.75% | 1,753 | 34.4% |
[ 61.0% - 61.5% ] 61.17% | 788 | 33.7% |
[ 61.5% - 62.0% ] 61.68% | 6,107 | 25.7% |
[ 62.0% - 62.5% ] 62.12% | 1,027 | 43.1% |
[ 62.5% - 63.0% ] 62.95% | 2,756 | 22.8% |
[ 63.0% - 63.5% ] 63.26% | 5,013 | 38.8% |
[ 63.5% - 64.0% ] 63.88% | 1,744 | 39.3% |
[ 64.0% - 64.5% ] 64.18% | 268 | 51.5% |
[ 64.5% - 65.0% ] 64.85% | 1,784 | 31.0% |
[ 65.5% - 66.0% ] 65.94% | 508 | 38.8% |
[ 66.5% - 67.0% ] 66.84% | 1,122 | 15.1% |
[ 67.0% - 67.5% ] 67.09% | 1,978 | 28.5% |
[ 67.5% - 68.0% ] 67.58% | 1,391 | 34.4% |
[ 68.0% - 68.5% ] 68.41% | 1,412 | 50.4% |
[ 68.5% - 69.0% ] 68.82% | 170 | 28.5% |
[ 69.5% - 70.0% ] 69.50% | 2,528 | 50.5% |
[ 70.5% - 71.0% ] 70.57% | 316 | 3.8% |
[ 72.0% - 72.5% ] 72.44% | 2,431 | 3.9% |
[ 73.0% - 73.5% ] 73.37% | 646 | 7.1% |
[ 74.5% - 75.0% ] 74.68% | 849 | 31.2% |
[ 75.5% - 76.0% ] 75.68% | 74 | 53.5% |
[ 76.5% - 77.0% ] 76.67% | 883 | 55.8% |
[ 77.5% - 78.0% ] 77.62% | 478 | 4.5% |
[ 78.5% - 79.0% ] 78.64% | 646 | 2.7% |
[ 80.5% - 81.0% ] 80.68% | 352 | 14.8% |
[ 91.0% - 91.5% ] 91.48% | 493 | 69.8% |
[ 91.5% - 92.0% ] 91.88% | 517 | 64.2% |
[ 99.5% - 100.0% ] 100.00% | 713 | 54.7% |