American Unemployment Among Women with Children Ages 6 to 17 years
COMPARE
American
Select to Compare
Unemployment Among Women with Children Ages 6 to 17 years
American Unemployment Among Women with Children Ages 6 to 17 years
10.4%
UNEMPLOYMENT | WOMEN W/ CHILDREN 6 TO 17
0.0/ 100
METRIC RATING
313th/ 347
METRIC RANK
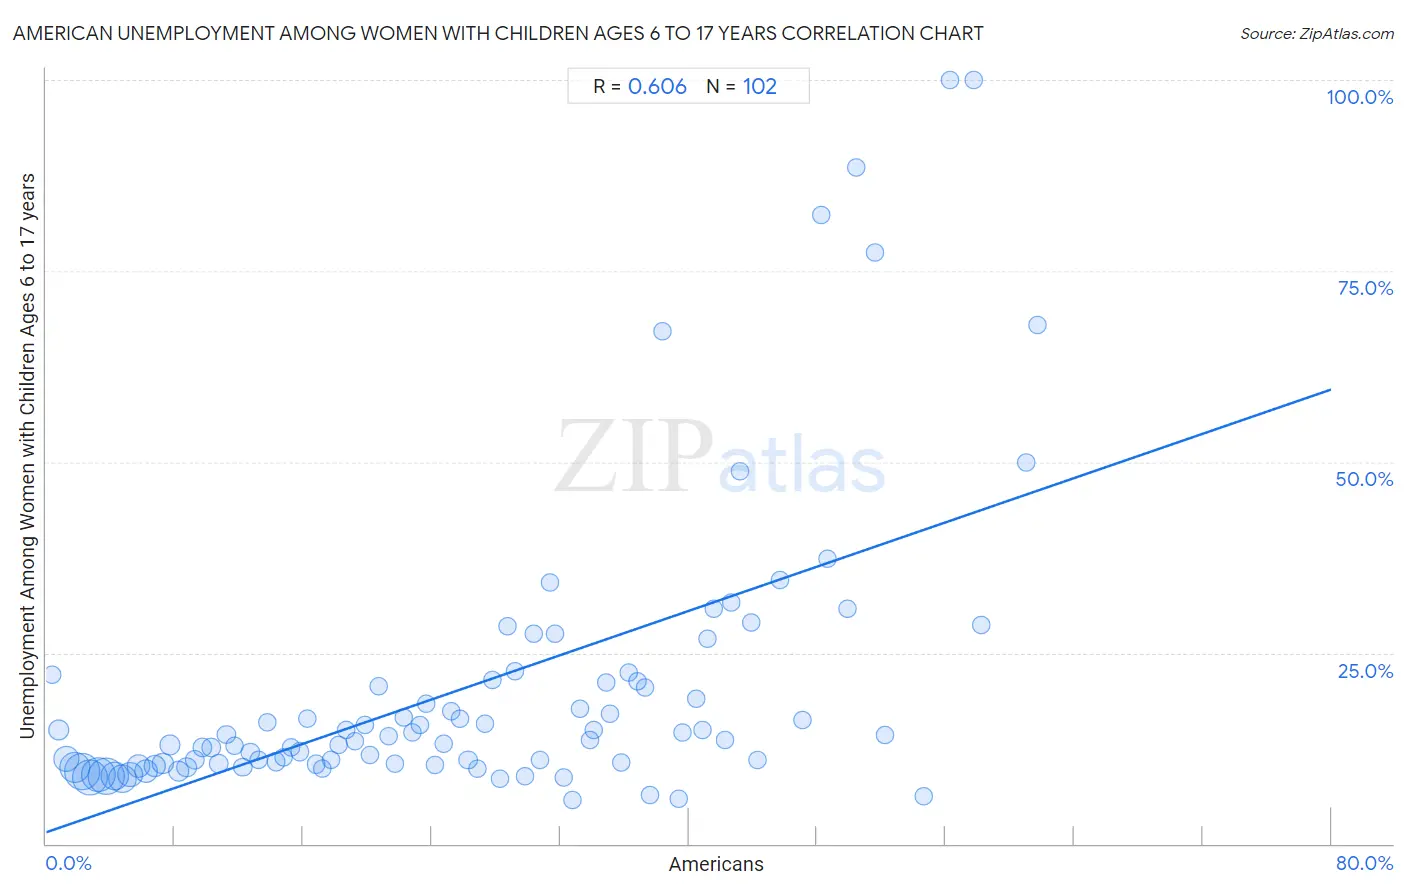
American Unemployment Among Women with Children Ages 6 to 17 years Correlation Chart
The statistical analysis conducted on geographies consisting of 361,036,029 people shows a significant positive correlation between the proportion of Americans and unemployment rate among women with children between the ages 6 and 17 in the United States with a correlation coefficient (R) of 0.606 and weighted average of 10.4%. On average, for every 1% (one percent) increase in Americans within a typical geography, there is an increase of 0.72% in unemployment rate among women with children between the ages 6 and 17.
It is essential to understand that the correlation between the percentage of Americans and unemployment rate among women with children between the ages 6 and 17 does not imply a direct cause-and-effect relationship. It remains uncertain whether the presence of Americans influences an upward or downward trend in the level of unemployment rate among women with children between the ages 6 and 17 within an area, or if Americans simply ended up residing in those areas with higher or lower levels of unemployment rate among women with children between the ages 6 and 17 due to other factors.
Demographics Similar to Americans by Unemployment Among Women with Children Ages 6 to 17 years
In terms of unemployment among women with children ages 6 to 17 years, the demographic groups most similar to Americans are Immigrants from Cabo Verde (10.4%, a difference of 0.050%), Bahamian (10.4%, a difference of 0.080%), African (10.4%, a difference of 0.18%), Immigrants from Dominica (10.5%, a difference of 0.83%), and Bermudan (10.5%, a difference of 0.94%).
| Demographics | Rating | Rank | Unemployment Among Women with Children Ages 6 to 17 years |
| Paraguayans | 0.0 /100 | #306 | Tragic 10.2% |
| Immigrants from Senegal | 0.0 /100 | #307 | Tragic 10.2% |
| Dutch West Indians | 0.0 /100 | #308 | Tragic 10.2% |
| French Canadians | 0.0 /100 | #309 | Tragic 10.3% |
| Alaska Natives | 0.0 /100 | #310 | Tragic 10.3% |
| Immigrants from Liberia | 0.0 /100 | #311 | Tragic 10.3% |
| Africans | 0.0 /100 | #312 | Tragic 10.4% |
| Americans | 0.0 /100 | #313 | Tragic 10.4% |
| Immigrants from Cabo Verde | 0.0 /100 | #314 | Tragic 10.4% |
| Bahamians | 0.0 /100 | #315 | Tragic 10.4% |
| Immigrants from Dominica | 0.0 /100 | #316 | Tragic 10.5% |
| Bermudans | 0.0 /100 | #317 | Tragic 10.5% |
| Delaware | 0.0 /100 | #318 | Tragic 10.5% |
| Immigrants from Uganda | 0.0 /100 | #319 | Tragic 10.7% |
| Apache | 0.0 /100 | #320 | Tragic 10.7% |
American Unemployment Among Women with Children Ages 6 to 17 years Correlation Summary
| Measurement | American Data | Unemployment Among Women with Children Ages 6 to 17 years Data |
| Minimum | 0.37% | 5.8% |
| Maximum | 61.7% | 100.0% |
| Range | 61.3% | 94.2% |
| Mean | 26.3% | 20.6% |
| Median | 25.5% | 13.9% |
| Interquartile 25% (IQ1) | 12.7% | 10.4% |
| Interquartile 75% (IQ3) | 38.3% | 21.3% |
| Interquartile Range (IQR) | 25.6% | 10.8% |
| Standard Deviation (Sample) | 16.2% | 19.3% |
| Standard Deviation (Population) | 16.1% | 19.2% |
Correlation Details
| American Percentile | Sample Size | Unemployment Among Women with Children Ages 6 to 17 years |
[ 0.0% - 0.5% ] 0.37% | 1,376,714 | 22.1% |
[ 0.5% - 1.0% ] 0.79% | 5,707,168 | 14.9% |
[ 1.0% - 1.5% ] 1.28% | 16,134,258 | 11.1% |
[ 1.5% - 2.0% ] 1.77% | 28,421,038 | 10.0% |
[ 2.0% - 2.5% ] 2.25% | 40,411,248 | 9.5% |
[ 2.5% - 3.0% ] 2.75% | 39,029,521 | 8.6% |
[ 3.0% - 3.5% ] 3.24% | 37,865,794 | 9.1% |
[ 3.5% - 4.0% ] 3.75% | 41,764,312 | 8.9% |
[ 4.0% - 4.5% ] 4.25% | 23,437,532 | 8.8% |
[ 4.5% - 5.0% ] 4.74% | 22,589,736 | 8.6% |
[ 5.0% - 5.5% ] 5.25% | 15,915,313 | 9.1% |
[ 5.5% - 6.0% ] 5.77% | 12,054,790 | 10.2% |
[ 6.0% - 6.5% ] 6.24% | 11,692,942 | 9.5% |
[ 6.5% - 7.0% ] 6.76% | 9,466,099 | 10.2% |
[ 7.0% - 7.5% ] 7.25% | 6,937,971 | 10.5% |
[ 7.5% - 8.0% ] 7.73% | 5,785,902 | 13.0% |
[ 8.0% - 8.5% ] 8.26% | 5,763,550 | 9.4% |
[ 8.5% - 9.0% ] 8.73% | 3,827,752 | 10.0% |
[ 9.0% - 9.5% ] 9.23% | 3,696,902 | 11.0% |
[ 9.5% - 10.0% ] 9.73% | 3,238,270 | 12.6% |
[ 10.0% - 10.5% ] 10.25% | 2,784,737 | 12.6% |
[ 10.5% - 11.0% ] 10.73% | 3,042,101 | 10.4% |
[ 11.0% - 11.5% ] 11.24% | 2,108,123 | 14.3% |
[ 11.5% - 12.0% ] 11.72% | 2,071,067 | 12.8% |
[ 12.0% - 12.5% ] 12.26% | 1,423,877 | 10.0% |
[ 12.5% - 13.0% ] 12.72% | 1,377,469 | 12.0% |
[ 13.0% - 13.5% ] 13.22% | 727,286 | 11.0% |
[ 13.5% - 14.0% ] 13.76% | 862,194 | 15.9% |
[ 14.0% - 14.5% ] 14.31% | 756,382 | 10.7% |
[ 14.5% - 15.0% ] 14.77% | 753,137 | 11.3% |
[ 15.0% - 15.5% ] 15.23% | 593,286 | 12.6% |
[ 15.5% - 16.0% ] 15.77% | 984,640 | 12.1% |
[ 16.0% - 16.5% ] 16.26% | 640,568 | 16.3% |
[ 16.5% - 17.0% ] 16.80% | 592,160 | 10.4% |
[ 17.0% - 17.5% ] 17.22% | 752,933 | 9.8% |
[ 17.5% - 18.0% ] 17.74% | 768,927 | 10.9% |
[ 18.0% - 18.5% ] 18.23% | 430,778 | 12.9% |
[ 18.5% - 19.0% ] 18.69% | 350,811 | 14.9% |
[ 19.0% - 19.5% ] 19.19% | 327,917 | 13.4% |
[ 19.5% - 20.0% ] 19.83% | 310,112 | 15.5% |
[ 20.0% - 20.5% ] 20.15% | 144,006 | 11.6% |
[ 20.5% - 21.0% ] 20.72% | 169,870 | 20.6% |
[ 21.0% - 21.5% ] 21.30% | 401,206 | 14.1% |
[ 21.5% - 22.0% ] 21.71% | 263,069 | 10.5% |
[ 22.0% - 22.5% ] 22.23% | 84,814 | 16.5% |
[ 22.5% - 23.0% ] 22.77% | 315,450 | 14.6% |
[ 23.0% - 23.5% ] 23.29% | 136,184 | 15.6% |
[ 23.5% - 24.0% ] 23.68% | 133,792 | 18.4% |
[ 24.0% - 24.5% ] 24.23% | 183,097 | 10.4% |
[ 24.5% - 25.0% ] 24.77% | 106,042 | 13.1% |
[ 25.0% - 25.5% ] 25.25% | 168,557 | 17.3% |
[ 25.5% - 26.0% ] 25.76% | 111,637 | 16.3% |
[ 26.0% - 26.5% ] 26.26% | 153,572 | 10.9% |
[ 26.5% - 27.0% ] 26.87% | 368,910 | 9.8% |
[ 27.0% - 27.5% ] 27.30% | 105,288 | 15.8% |
[ 27.5% - 28.0% ] 27.76% | 165,461 | 21.5% |
[ 28.0% - 28.5% ] 28.26% | 114,835 | 8.5% |
[ 28.5% - 29.0% ] 28.70% | 42,167 | 28.5% |
[ 29.0% - 29.5% ] 29.17% | 88,002 | 22.7% |
[ 29.5% - 30.0% ] 29.78% | 58,336 | 8.8% |
[ 30.0% - 30.5% ] 30.37% | 32,021 | 27.6% |
[ 30.5% - 31.0% ] 30.75% | 172,871 | 10.9% |
[ 31.0% - 31.5% ] 31.38% | 25,263 | 34.3% |
[ 31.5% - 32.0% ] 31.70% | 17,029 | 27.5% |
[ 32.0% - 32.5% ] 32.23% | 129,517 | 8.6% |
[ 32.5% - 33.0% ] 32.77% | 66,098 | 5.8% |
[ 33.0% - 33.5% ] 33.25% | 32,825 | 17.6% |
[ 33.5% - 34.0% ] 33.84% | 6,622 | 13.5% |
[ 34.0% - 34.5% ] 34.11% | 8,292 | 15.0% |
[ 34.5% - 35.0% ] 34.83% | 43,486 | 21.1% |
[ 35.0% - 35.5% ] 35.12% | 26,858 | 17.1% |
[ 35.5% - 36.0% ] 35.76% | 39,917 | 10.7% |
[ 36.0% - 36.5% ] 36.25% | 80,687 | 22.4% |
[ 36.5% - 37.0% ] 36.83% | 21,404 | 21.3% |
[ 37.0% - 37.5% ] 37.28% | 20,155 | 20.4% |
[ 37.5% - 38.0% ] 37.59% | 38,865 | 6.4% |
[ 38.0% - 38.5% ] 38.33% | 3,814 | 67.1% |
[ 39.0% - 39.5% ] 39.35% | 39,018 | 6.0% |
[ 39.5% - 40.0% ] 39.64% | 8,343 | 14.6% |
[ 40.0% - 40.5% ] 40.45% | 10,630 | 19.1% |
[ 40.5% - 41.0% ] 40.82% | 9,645 | 14.8% |
[ 41.0% - 41.5% ] 41.14% | 8,119 | 26.9% |
[ 41.5% - 42.0% ] 41.59% | 1,707 | 30.8% |
[ 42.0% - 42.5% ] 42.25% | 5,550 | 13.6% |
[ 42.5% - 43.0% ] 42.63% | 5,074 | 31.6% |
[ 43.0% - 43.5% ] 43.19% | 7,697 | 48.8% |
[ 43.5% - 44.0% ] 43.91% | 23,485 | 29.0% |
[ 44.0% - 44.5% ] 44.31% | 5,786 | 10.9% |
[ 45.5% - 46.0% ] 45.68% | 6,270 | 34.5% |
[ 47.0% - 47.5% ] 47.12% | 17,094 | 16.2% |
[ 48.0% - 48.5% ] 48.25% | 1,681 | 82.4% |
[ 48.5% - 49.0% ] 48.67% | 1,206 | 37.3% |
[ 49.5% - 50.0% ] 49.90% | 4,495 | 30.8% |
[ 50.0% - 50.5% ] 50.40% | 4,177 | 88.5% |
[ 51.5% - 52.0% ] 51.59% | 4,788 | 77.4% |
[ 52.0% - 52.5% ] 52.25% | 356 | 14.3% |
[ 54.5% - 55.0% ] 54.59% | 8,690 | 6.2% |
[ 56.0% - 56.5% ] 56.23% | 594 | 100.0% |
[ 57.5% - 58.0% ] 57.78% | 45 | 100.0% |
[ 58.0% - 58.5% ] 58.24% | 510 | 28.6% |
[ 60.5% - 61.0% ] 60.99% | 764 | 50.0% |
[ 61.5% - 62.0% ] 61.68% | 4,969 | 68.0% |