U.S. Virgin Islander 1 or more Vehicles in Household
COMPARE
U.S. Virgin Islander
Select to Compare
1 or more Vehicles in Household
U.S. Virgin Islander 1 or more Vehicles in Household
84.6%
1+ VEHICLES AVAILABLE
0.0/ 100
METRIC RATING
310th/ 347
METRIC RANK
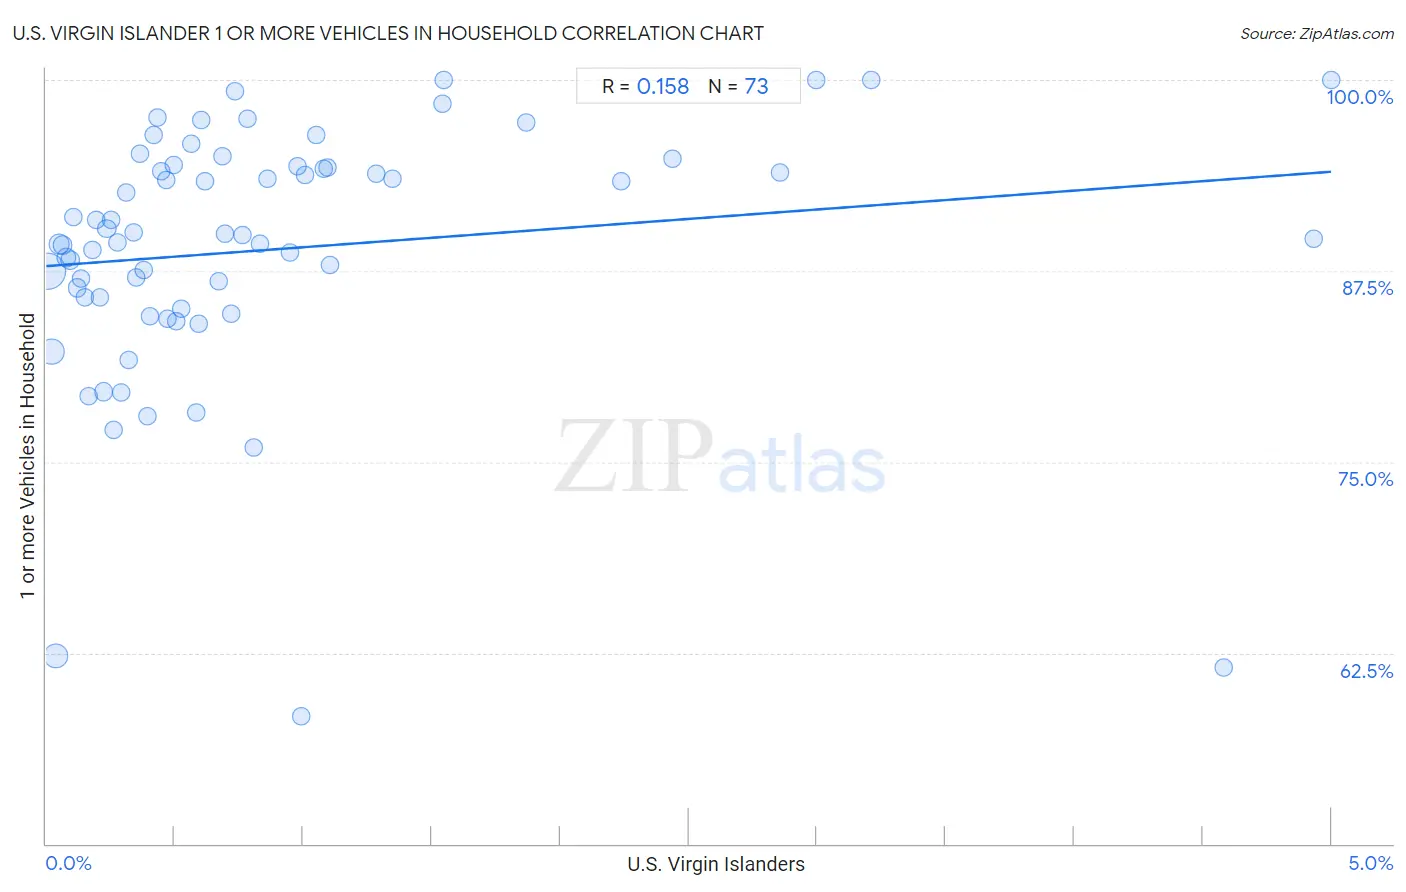
U.S. Virgin Islander 1 or more Vehicles in Household Correlation Chart
The statistical analysis conducted on geographies consisting of 87,430,721 people shows a poor positive correlation between the proportion of U.S. Virgin Islanders and percentage of households with 1 or more vehicles available in the United States with a correlation coefficient (R) of 0.158 and weighted average of 84.6%. On average, for every 1% (one percent) increase in U.S. Virgin Islanders within a typical geography, there is an increase of 1.2% in percentage of households with 1 or more vehicles available.
It is essential to understand that the correlation between the percentage of U.S. Virgin Islanders and percentage of households with 1 or more vehicles available does not imply a direct cause-and-effect relationship. It remains uncertain whether the presence of U.S. Virgin Islanders influences an upward or downward trend in the level of percentage of households with 1 or more vehicles available within an area, or if U.S. Virgin Islanders simply ended up residing in those areas with higher or lower levels of percentage of households with 1 or more vehicles available due to other factors.
Demographics Similar to U.S. Virgin Islanders by 1 or more Vehicles in Household
In terms of 1 or more vehicles in household, the demographic groups most similar to U.S. Virgin Islanders are Immigrants from Haiti (84.7%, a difference of 0.030%), Immigrants from Belize (84.7%, a difference of 0.040%), Puerto Rican (84.6%, a difference of 0.040%), Tohono O'odham (84.7%, a difference of 0.070%), and Cape Verdean (84.5%, a difference of 0.15%).
| Demographics | Rating | Rank | 1 or more Vehicles in Household |
| Immigrants from Greece | 0.0 /100 | #303 | Tragic 85.4% |
| Immigrants from Ukraine | 0.0 /100 | #304 | Tragic 85.2% |
| Immigrants from China | 0.0 /100 | #305 | Tragic 84.9% |
| Immigrants from Western Africa | 0.0 /100 | #306 | Tragic 84.9% |
| Tohono O'odham | 0.0 /100 | #307 | Tragic 84.7% |
| Immigrants from Belize | 0.0 /100 | #308 | Tragic 84.7% |
| Immigrants from Haiti | 0.0 /100 | #309 | Tragic 84.7% |
| U.S. Virgin Islanders | 0.0 /100 | #310 | Tragic 84.6% |
| Puerto Ricans | 0.0 /100 | #311 | Tragic 84.6% |
| Cape Verdeans | 0.0 /100 | #312 | Tragic 84.5% |
| Immigrants from Israel | 0.0 /100 | #313 | Tragic 84.5% |
| Albanians | 0.0 /100 | #314 | Tragic 84.4% |
| Cypriots | 0.0 /100 | #315 | Tragic 84.4% |
| Alaska Natives | 0.0 /100 | #316 | Tragic 83.8% |
| Ghanaians | 0.0 /100 | #317 | Tragic 83.6% |
U.S. Virgin Islander 1 or more Vehicles in Household Correlation Summary
| Measurement | U.S. Virgin Islander Data | 1 or more Vehicles in Household Data |
| Minimum | 0.0060% | 58.3% |
| Maximum | 5.0% | 100.0% |
| Range | 5.0% | 41.7% |
| Mean | 0.88% | 88.9% |
| Median | 0.52% | 89.9% |
| Interquartile 25% (IQ1) | 0.26% | 85.4% |
| Interquartile 75% (IQ3) | 1.00% | 94.3% |
| Interquartile Range (IQR) | 0.74% | 8.9% |
| Standard Deviation (Sample) | 1.1% | 8.4% |
| Standard Deviation (Population) | 1.1% | 8.3% |
Correlation Details
| U.S. Virgin Islander Percentile | Sample Size | 1 or more Vehicles in Household |
[ 0.0% - 0.5% ] 0.0060% | 38,650,694 | 87.5% |
[ 0.0% - 0.5% ] 0.020% | 13,785,726 | 82.2% |
[ 0.0% - 0.5% ] 0.036% | 14,364,905 | 62.3% |
[ 0.0% - 0.5% ] 0.050% | 3,648,517 | 89.3% |
[ 0.0% - 0.5% ] 0.064% | 2,286,273 | 89.2% |
[ 0.0% - 0.5% ] 0.079% | 2,230,708 | 88.4% |
[ 0.0% - 0.5% ] 0.093% | 1,892,764 | 88.2% |
[ 0.0% - 0.5% ] 0.11% | 1,653,518 | 91.0% |
[ 0.0% - 0.5% ] 0.12% | 1,078,039 | 86.4% |
[ 0.0% - 0.5% ] 0.14% | 1,041,176 | 87.0% |
[ 0.0% - 0.5% ] 0.15% | 643,059 | 85.7% |
[ 0.0% - 0.5% ] 0.16% | 385,386 | 79.3% |
[ 0.0% - 0.5% ] 0.18% | 295,741 | 88.8% |
[ 0.0% - 0.5% ] 0.19% | 337,075 | 90.8% |
[ 0.0% - 0.5% ] 0.21% | 500,273 | 85.8% |
[ 0.0% - 0.5% ] 0.22% | 490,125 | 79.6% |
[ 0.0% - 0.5% ] 0.24% | 308,816 | 90.3% |
[ 0.0% - 0.5% ] 0.25% | 389,797 | 90.8% |
[ 0.0% - 0.5% ] 0.26% | 381,877 | 77.1% |
[ 0.0% - 0.5% ] 0.28% | 299,504 | 89.4% |
[ 0.0% - 0.5% ] 0.29% | 203,721 | 79.6% |
[ 0.0% - 0.5% ] 0.31% | 68,733 | 92.6% |
[ 0.0% - 0.5% ] 0.32% | 186,497 | 81.6% |
[ 0.0% - 0.5% ] 0.34% | 442,018 | 90.1% |
[ 0.0% - 0.5% ] 0.35% | 212,624 | 87.1% |
[ 0.0% - 0.5% ] 0.37% | 115,731 | 95.2% |
[ 0.0% - 0.5% ] 0.38% | 37,275 | 87.6% |
[ 0.0% - 0.5% ] 0.39% | 179,183 | 78.0% |
[ 0.0% - 0.5% ] 0.40% | 32,285 | 84.5% |
[ 0.0% - 0.5% ] 0.42% | 145,330 | 96.4% |
[ 0.0% - 0.5% ] 0.43% | 3,020 | 97.5% |
[ 0.0% - 0.5% ] 0.45% | 47,668 | 94.0% |
[ 0.0% - 0.5% ] 0.47% | 47,883 | 93.4% |
[ 0.0% - 0.5% ] 0.47% | 37,604 | 84.4% |
[ 0.0% - 0.5% ] 0.49% | 91,974 | 94.4% |
[ 0.5% - 1.0% ] 0.51% | 32,450 | 84.2% |
[ 0.5% - 1.0% ] 0.52% | 76,887 | 85.1% |
[ 0.5% - 1.0% ] 0.57% | 19,959 | 95.9% |
[ 0.5% - 1.0% ] 0.58% | 32,964 | 78.2% |
[ 0.5% - 1.0% ] 0.59% | 22,294 | 84.1% |
[ 0.5% - 1.0% ] 0.61% | 1,156 | 97.4% |
[ 0.5% - 1.0% ] 0.62% | 53,388 | 93.4% |
[ 0.5% - 1.0% ] 0.67% | 1,490 | 86.8% |
[ 0.5% - 1.0% ] 0.68% | 78,055 | 95.0% |
[ 0.5% - 1.0% ] 0.69% | 135,828 | 89.9% |
[ 0.5% - 1.0% ] 0.72% | 43,820 | 84.7% |
[ 0.5% - 1.0% ] 0.73% | 5,732 | 99.3% |
[ 0.5% - 1.0% ] 0.77% | 20,903 | 89.9% |
[ 0.5% - 1.0% ] 0.78% | 255 | 97.5% |
[ 0.5% - 1.0% ] 0.81% | 2,725 | 75.9% |
[ 0.5% - 1.0% ] 0.83% | 88,272 | 89.3% |
[ 0.5% - 1.0% ] 0.86% | 30,306 | 93.5% |
[ 0.5% - 1.0% ] 0.95% | 43,516 | 88.7% |
[ 0.5% - 1.0% ] 0.98% | 14,741 | 94.4% |
[ 0.5% - 1.0% ] 0.99% | 1,814 | 58.3% |
[ 1.0% - 1.5% ] 1.01% | 27,594 | 93.8% |
[ 1.0% - 1.5% ] 1.05% | 37,954 | 96.4% |
[ 1.0% - 1.5% ] 1.08% | 13,706 | 94.2% |
[ 1.0% - 1.5% ] 1.09% | 15,289 | 94.3% |
[ 1.0% - 1.5% ] 1.10% | 65,549 | 87.9% |
[ 1.0% - 1.5% ] 1.28% | 19,088 | 93.8% |
[ 1.0% - 1.5% ] 1.35% | 3,415 | 93.5% |
[ 1.5% - 2.0% ] 1.54% | 13,425 | 98.5% |
[ 1.5% - 2.0% ] 1.54% | 971 | 100.0% |
[ 1.5% - 2.0% ] 1.87% | 2,465 | 97.3% |
[ 2.0% - 2.5% ] 2.24% | 2,144 | 93.4% |
[ 2.0% - 2.5% ] 2.44% | 4,880 | 94.9% |
[ 2.5% - 3.0% ] 2.86% | 70 | 93.9% |
[ 2.5% - 3.0% ] 3.00% | 467 | 100.0% |
[ 3.0% - 3.5% ] 3.21% | 218 | 100.0% |
[ 4.5% - 5.0% ] 4.58% | 786 | 61.5% |
[ 4.5% - 5.0% ] 4.93% | 446 | 89.6% |
[ 5.0% - 5.5% ] 5.00% | 180 | 100.0% |