Slovene College, 1 year or more
COMPARE
Slovene
Select to Compare
College, 1 year or more
Slovene College, 1 year or more
60.9%
COLLEGE, 1 YEAR OR MORE
86.5/ 100
METRIC RATING
137th/ 347
METRIC RANK
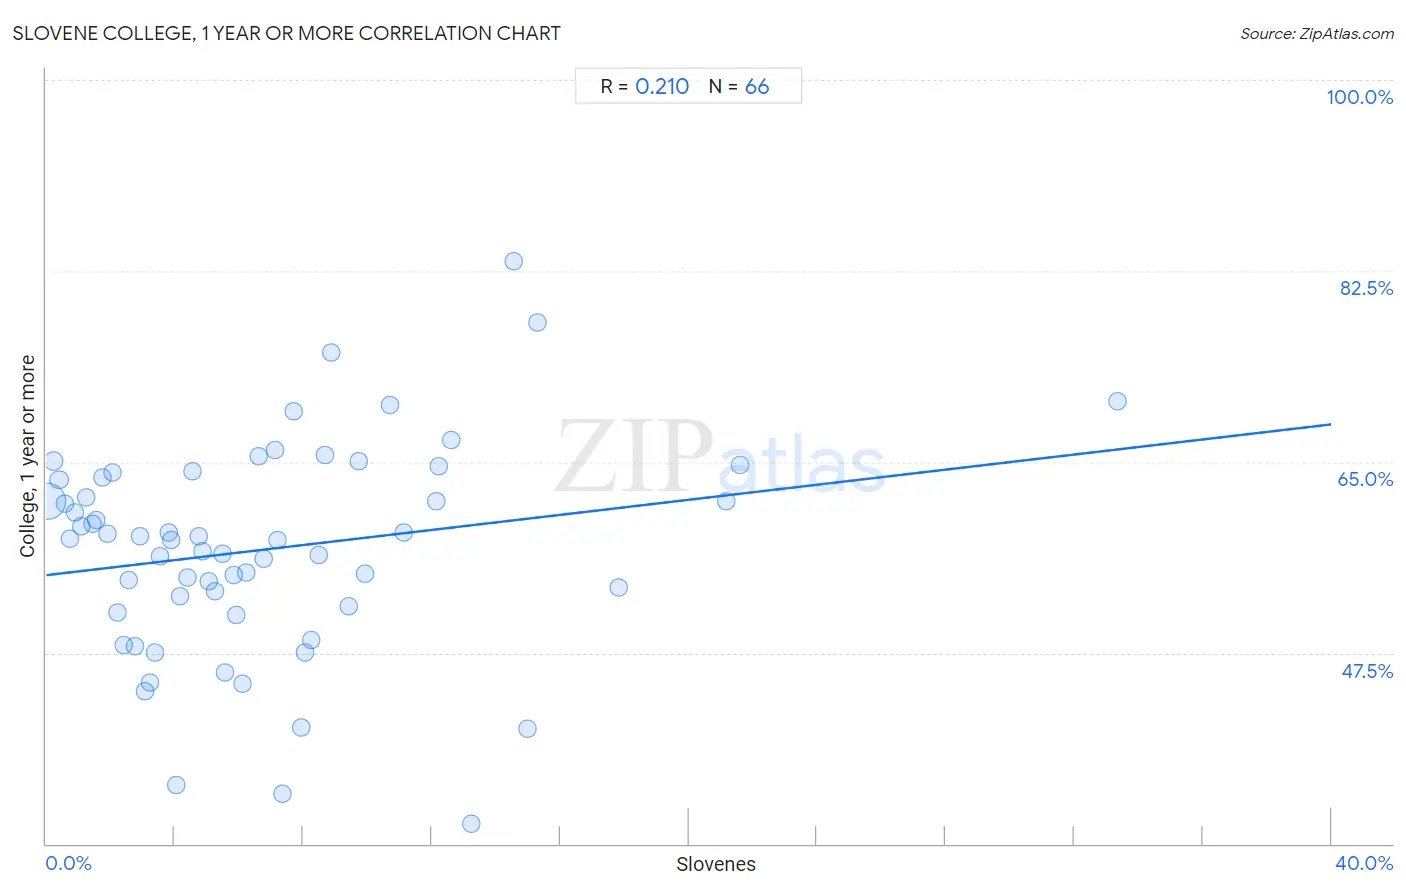
Slovene College, 1 year or more Correlation Chart
The statistical analysis conducted on geographies consisting of 261,353,489 people shows a weak positive correlation between the proportion of Slovenes and percentage of population with at least college, 1 year or more education in the United States with a correlation coefficient (R) of 0.210 and weighted average of 60.9%. On average, for every 1% (one percent) increase in Slovenes within a typical geography, there is an increase of 0.35% in percentage of population with at least college, 1 year or more education.
It is essential to understand that the correlation between the percentage of Slovenes and percentage of population with at least college, 1 year or more education does not imply a direct cause-and-effect relationship. It remains uncertain whether the presence of Slovenes influences an upward or downward trend in the level of percentage of population with at least college, 1 year or more education within an area, or if Slovenes simply ended up residing in those areas with higher or lower levels of percentage of population with at least college, 1 year or more education due to other factors.
Demographics Similar to Slovenes by College, 1 year or more
In terms of college, 1 year or more, the demographic groups most similar to Slovenes are Basque (60.9%, a difference of 0.090%), Immigrants from Uganda (60.9%, a difference of 0.11%), Immigrants from Venezuela (61.0%, a difference of 0.16%), Immigrants from Uzbekistan (61.0%, a difference of 0.18%), and Scandinavian (61.0%, a difference of 0.20%).
| Demographics | Rating | Rank | College, 1 year or more |
| Italians | 89.5 /100 | #130 | Excellent 61.1% |
| Immigrants from Morocco | 89.5 /100 | #131 | Excellent 61.1% |
| Scandinavians | 88.2 /100 | #132 | Excellent 61.0% |
| Immigrants from Uzbekistan | 88.0 /100 | #133 | Excellent 61.0% |
| Immigrants from Venezuela | 87.9 /100 | #134 | Excellent 61.0% |
| Immigrants from Uganda | 87.4 /100 | #135 | Excellent 60.9% |
| Basques | 87.2 /100 | #136 | Excellent 60.9% |
| Slovenes | 86.5 /100 | #137 | Excellent 60.9% |
| Taiwanese | 84.3 /100 | #138 | Excellent 60.7% |
| Immigrants from Eritrea | 84.3 /100 | #139 | Excellent 60.7% |
| Iraqis | 83.3 /100 | #140 | Excellent 60.7% |
| Immigrants from Afghanistan | 83.1 /100 | #141 | Excellent 60.7% |
| Poles | 82.8 /100 | #142 | Excellent 60.7% |
| Canadians | 82.7 /100 | #143 | Excellent 60.6% |
| Czechs | 81.9 /100 | #144 | Excellent 60.6% |
Slovene College, 1 year or more Correlation Summary
| Measurement | Slovene Data | College, 1 year or more Data |
| Minimum | 0.049% | 31.8% |
| Maximum | 33.3% | 83.3% |
| Range | 33.3% | 51.5% |
| Mean | 6.9% | 57.0% |
| Median | 5.5% | 57.9% |
| Interquartile 25% (IQ1) | 2.8% | 51.8% |
| Interquartile 75% (IQ3) | 8.9% | 63.6% |
| Interquartile Range (IQR) | 6.1% | 11.8% |
| Standard Deviation (Sample) | 5.9% | 9.8% |
| Standard Deviation (Population) | 5.9% | 9.7% |
Correlation Details
| Slovene Percentile | Sample Size | College, 1 year or more |
[ 0.0% - 0.5% ] 0.049% | 226,175,134 | 61.4% |
[ 0.0% - 0.5% ] 0.23% | 19,618,238 | 65.1% |
[ 0.0% - 0.5% ] 0.40% | 6,017,873 | 63.3% |
[ 0.5% - 1.0% ] 0.58% | 3,067,057 | 61.2% |
[ 0.5% - 1.0% ] 0.74% | 1,810,012 | 58.0% |
[ 0.5% - 1.0% ] 0.90% | 1,213,457 | 60.4% |
[ 1.0% - 1.5% ] 1.10% | 459,427 | 59.1% |
[ 1.0% - 1.5% ] 1.25% | 759,976 | 61.8% |
[ 1.0% - 1.5% ] 1.43% | 424,282 | 59.3% |
[ 1.5% - 2.0% ] 1.56% | 244,549 | 59.7% |
[ 1.5% - 2.0% ] 1.75% | 282,056 | 63.6% |
[ 1.5% - 2.0% ] 1.91% | 116,405 | 58.4% |
[ 2.0% - 2.5% ] 2.05% | 207,278 | 64.1% |
[ 2.0% - 2.5% ] 2.21% | 54,291 | 51.2% |
[ 2.0% - 2.5% ] 2.40% | 83,167 | 48.3% |
[ 2.5% - 3.0% ] 2.58% | 39,541 | 54.2% |
[ 2.5% - 3.0% ] 2.75% | 54,342 | 48.1% |
[ 2.5% - 3.0% ] 2.90% | 44,911 | 58.2% |
[ 3.0% - 3.5% ] 3.09% | 53,508 | 44.0% |
[ 3.0% - 3.5% ] 3.22% | 16,159 | 44.7% |
[ 3.0% - 3.5% ] 3.39% | 30,690 | 47.5% |
[ 3.5% - 4.0% ] 3.54% | 74,929 | 56.3% |
[ 3.5% - 4.0% ] 3.80% | 14,712 | 58.5% |
[ 3.5% - 4.0% ] 3.89% | 7,867 | 57.8% |
[ 4.0% - 4.5% ] 4.05% | 3,502 | 35.4% |
[ 4.0% - 4.5% ] 4.18% | 3,685 | 52.7% |
[ 4.0% - 4.5% ] 4.41% | 12,073 | 54.4% |
[ 4.5% - 5.0% ] 4.55% | 10,587 | 64.1% |
[ 4.5% - 5.0% ] 4.74% | 25,059 | 58.2% |
[ 4.5% - 5.0% ] 4.87% | 62,712 | 56.8% |
[ 5.0% - 5.5% ] 5.05% | 67,112 | 54.0% |
[ 5.0% - 5.5% ] 5.25% | 89,439 | 53.1% |
[ 5.0% - 5.5% ] 5.47% | 439 | 56.5% |
[ 5.5% - 6.0% ] 5.56% | 2,912 | 45.7% |
[ 5.5% - 6.0% ] 5.83% | 3,500 | 54.6% |
[ 5.5% - 6.0% ] 5.93% | 38,004 | 50.9% |
[ 6.0% - 6.5% ] 6.12% | 2,874 | 44.7% |
[ 6.0% - 6.5% ] 6.21% | 3,899 | 54.8% |
[ 6.5% - 7.0% ] 6.63% | 8,105 | 65.5% |
[ 6.5% - 7.0% ] 6.76% | 38,791 | 56.1% |
[ 7.0% - 7.5% ] 7.11% | 2,530 | 66.1% |
[ 7.0% - 7.5% ] 7.18% | 41,270 | 57.8% |
[ 7.0% - 7.5% ] 7.37% | 353 | 34.5% |
[ 7.5% - 8.0% ] 7.69% | 39 | 69.7% |
[ 7.5% - 8.0% ] 7.95% | 176 | 40.6% |
[ 8.0% - 8.5% ] 8.04% | 1,455 | 47.6% |
[ 8.0% - 8.5% ] 8.26% | 13,664 | 48.7% |
[ 8.0% - 8.5% ] 8.47% | 2,019 | 56.5% |
[ 8.5% - 9.0% ] 8.67% | 9,972 | 65.7% |
[ 8.5% - 9.0% ] 8.86% | 158 | 75.0% |
[ 9.0% - 9.5% ] 9.40% | 17,138 | 51.8% |
[ 9.5% - 10.0% ] 9.75% | 7,449 | 65.1% |
[ 9.5% - 10.0% ] 9.92% | 1,461 | 54.7% |
[ 10.5% - 11.0% ] 10.70% | 5,297 | 70.2% |
[ 11.0% - 11.5% ] 11.12% | 998 | 58.5% |
[ 12.0% - 12.5% ] 12.14% | 346 | 61.4% |
[ 12.0% - 12.5% ] 12.23% | 1,071 | 64.5% |
[ 12.5% - 13.0% ] 12.59% | 3,265 | 67.0% |
[ 13.0% - 13.5% ] 13.25% | 151 | 31.8% |
[ 14.5% - 15.0% ] 14.56% | 103 | 83.3% |
[ 14.5% - 15.0% ] 14.97% | 314 | 40.5% |
[ 15.0% - 15.5% ] 15.28% | 72 | 77.8% |
[ 17.5% - 18.0% ] 17.80% | 410 | 53.4% |
[ 21.0% - 21.5% ] 21.15% | 104 | 61.4% |
[ 21.5% - 22.0% ] 21.60% | 1,102 | 64.7% |
[ 33.0% - 33.5% ] 33.33% | 18 | 70.6% |