Paraguayan Disability
COMPARE
Paraguayan
Select to Compare
Disability
Paraguayan Disability
10.6%
DISABILITY
100.0/ 100
METRIC RATING
32nd/ 347
METRIC RANK
Paraguayan Disability Correlation Chart
The statistical analysis conducted on geographies consisting of 95,111,700 people shows a slight positive correlation between the proportion of Paraguayans and percentage of population with a disability in the United States with a correlation coefficient (R) of 0.054 and weighted average of 10.6%. On average, for every 1% (one percent) increase in Paraguayans within a typical geography, there is an increase of 0.13% in percentage of population with a disability.
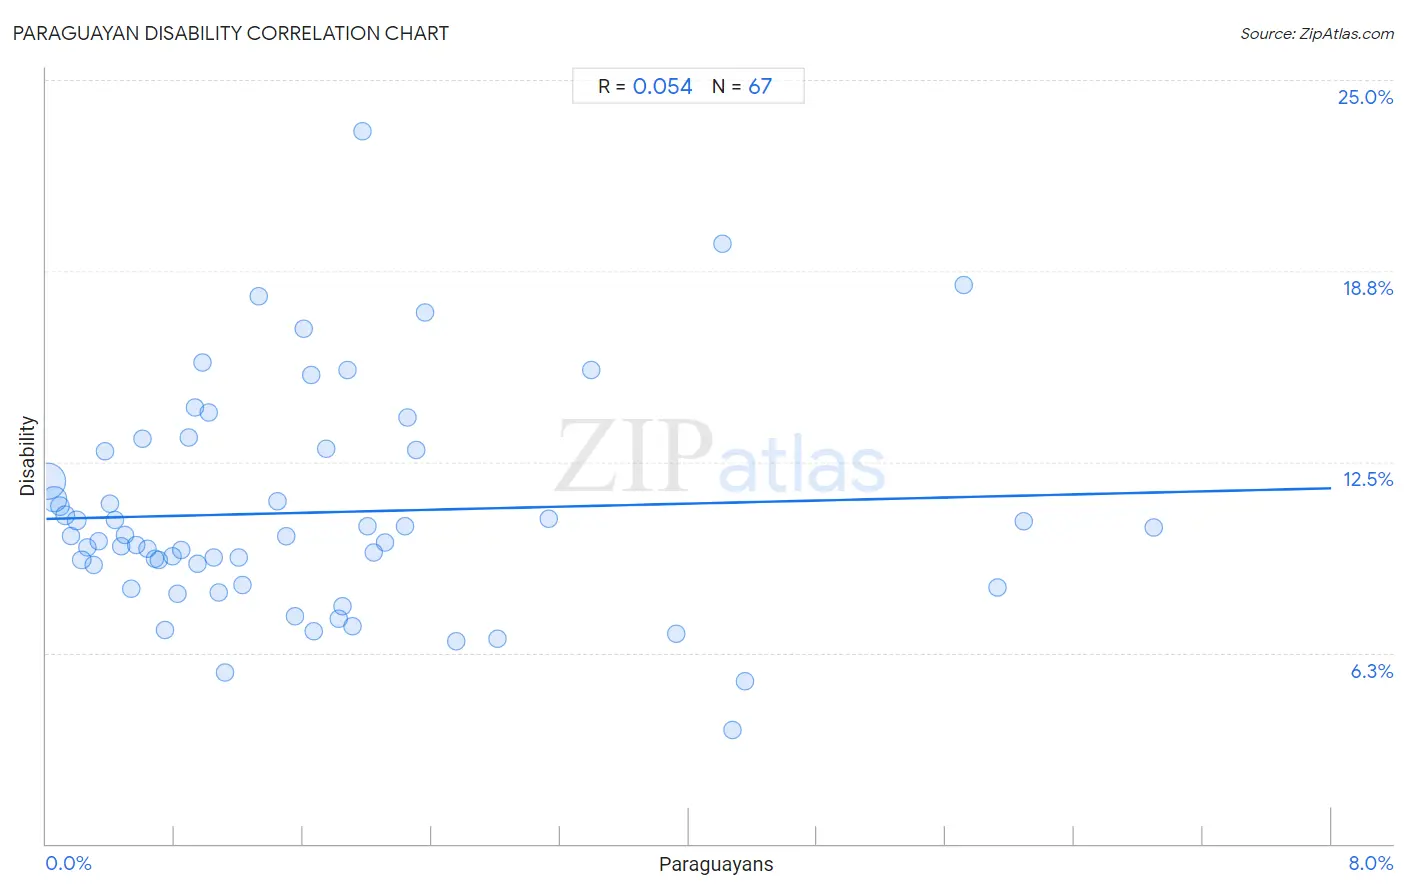
It is essential to understand that the correlation between the percentage of Paraguayans and percentage of population with a disability does not imply a direct cause-and-effect relationship. It remains uncertain whether the presence of Paraguayans influences an upward or downward trend in the level of percentage of population with a disability within an area, or if Paraguayans simply ended up residing in those areas with higher or lower levels of percentage of population with a disability due to other factors.
Demographics Similar to Paraguayans by Disability
In terms of disability, the demographic groups most similar to Paraguayans are Immigrants from Egypt (10.6%, a difference of 0.10%), Immigrants from Turkey (10.6%, a difference of 0.17%), Immigrants from Kuwait (10.7%, a difference of 0.25%), Immigrants from Argentina (10.6%, a difference of 0.33%), and Egyptian (10.6%, a difference of 0.46%).
| Demographics | Rating | Rank | Disability |
| Immigrants from Malaysia | 100.0 /100 | #25 | Exceptional 10.6% |
| Argentineans | 100.0 /100 | #26 | Exceptional 10.6% |
| Cypriots | 100.0 /100 | #27 | Exceptional 10.6% |
| Egyptians | 100.0 /100 | #28 | Exceptional 10.6% |
| Immigrants from Argentina | 100.0 /100 | #29 | Exceptional 10.6% |
| Immigrants from Turkey | 100.0 /100 | #30 | Exceptional 10.6% |
| Immigrants from Egypt | 100.0 /100 | #31 | Exceptional 10.6% |
| Paraguayans | 100.0 /100 | #32 | Exceptional 10.6% |
| Immigrants from Kuwait | 100.0 /100 | #33 | Exceptional 10.7% |
| Immigrants from Ethiopia | 100.0 /100 | #34 | Exceptional 10.7% |
| Immigrants from Indonesia | 100.0 /100 | #35 | Exceptional 10.7% |
| Ethiopians | 100.0 /100 | #36 | Exceptional 10.7% |
| Turks | 100.0 /100 | #37 | Exceptional 10.7% |
| Afghans | 99.9 /100 | #38 | Exceptional 10.8% |
| Cambodians | 99.9 /100 | #39 | Exceptional 10.8% |
Paraguayan Disability Correlation Summary
| Measurement | Paraguayan Data | Disability Data |
| Minimum | 0.0097% | 3.7% |
| Maximum | 6.9% | 23.3% |
| Range | 6.9% | 19.6% |
| Mean | 1.7% | 10.8% |
| Median | 1.2% | 10.1% |
| Interquartile 25% (IQ1) | 0.56% | 8.5% |
| Interquartile 75% (IQ3) | 2.1% | 12.9% |
| Interquartile Range (IQR) | 1.6% | 4.4% |
| Standard Deviation (Sample) | 1.6% | 3.6% |
| Standard Deviation (Population) | 1.5% | 3.6% |
Correlation Details
| Paraguayan Percentile | Sample Size | Disability |
[ 0.0% - 0.5% ] 0.0097% | 59,466,563 | 11.9% |
[ 0.0% - 0.5% ] 0.048% | 21,220,711 | 11.3% |
[ 0.0% - 0.5% ] 0.086% | 4,499,602 | 11.0% |
[ 0.0% - 0.5% ] 0.12% | 2,172,198 | 10.8% |
[ 0.0% - 0.5% ] 0.16% | 1,491,002 | 10.1% |
[ 0.0% - 0.5% ] 0.19% | 1,311,719 | 10.6% |
[ 0.0% - 0.5% ] 0.22% | 1,048,184 | 9.3% |
[ 0.0% - 0.5% ] 0.26% | 901,145 | 9.7% |
[ 0.0% - 0.5% ] 0.30% | 358,930 | 9.1% |
[ 0.0% - 0.5% ] 0.33% | 495,571 | 9.9% |
[ 0.0% - 0.5% ] 0.37% | 113,195 | 12.8% |
[ 0.0% - 0.5% ] 0.39% | 417,057 | 11.1% |
[ 0.0% - 0.5% ] 0.43% | 231,985 | 10.6% |
[ 0.0% - 0.5% ] 0.47% | 98,814 | 9.7% |
[ 0.0% - 0.5% ] 0.49% | 196,871 | 10.1% |
[ 0.5% - 1.0% ] 0.53% | 49,954 | 8.3% |
[ 0.5% - 1.0% ] 0.56% | 43,661 | 9.8% |
[ 0.5% - 1.0% ] 0.60% | 19,250 | 13.2% |
[ 0.5% - 1.0% ] 0.63% | 39,165 | 9.6% |
[ 0.5% - 1.0% ] 0.67% | 142,413 | 9.3% |
[ 0.5% - 1.0% ] 0.70% | 51,402 | 9.3% |
[ 0.5% - 1.0% ] 0.74% | 103,406 | 7.0% |
[ 0.5% - 1.0% ] 0.79% | 23,838 | 9.4% |
[ 0.5% - 1.0% ] 0.81% | 34,779 | 8.2% |
[ 0.5% - 1.0% ] 0.84% | 32,958 | 9.6% |
[ 0.5% - 1.0% ] 0.89% | 32,940 | 13.3% |
[ 0.5% - 1.0% ] 0.93% | 52,168 | 14.3% |
[ 0.5% - 1.0% ] 0.94% | 74,018 | 9.2% |
[ 0.5% - 1.0% ] 0.97% | 42,808 | 15.7% |
[ 1.0% - 1.5% ] 1.01% | 20,482 | 14.1% |
[ 1.0% - 1.5% ] 1.05% | 52,580 | 9.4% |
[ 1.0% - 1.5% ] 1.08% | 7,154 | 8.2% |
[ 1.0% - 1.5% ] 1.11% | 24,656 | 5.6% |
[ 1.0% - 1.5% ] 1.20% | 25,130 | 9.4% |
[ 1.0% - 1.5% ] 1.22% | 1,639 | 8.5% |
[ 1.0% - 1.5% ] 1.32% | 32,720 | 17.9% |
[ 1.0% - 1.5% ] 1.44% | 4,929 | 11.2% |
[ 1.0% - 1.5% ] 1.50% | 7,822 | 10.1% |
[ 1.5% - 2.0% ] 1.55% | 11,518 | 7.4% |
[ 1.5% - 2.0% ] 1.61% | 5,725 | 16.9% |
[ 1.5% - 2.0% ] 1.65% | 5,632 | 15.4% |
[ 1.5% - 2.0% ] 1.67% | 1,739 | 7.0% |
[ 1.5% - 2.0% ] 1.74% | 1,378 | 12.9% |
[ 1.5% - 2.0% ] 1.82% | 3,399 | 7.4% |
[ 1.5% - 2.0% ] 1.85% | 9,581 | 7.8% |
[ 1.5% - 2.0% ] 1.87% | 800 | 15.5% |
[ 1.5% - 2.0% ] 1.91% | 23,734 | 7.1% |
[ 1.5% - 2.0% ] 1.97% | 712 | 23.3% |
[ 2.0% - 2.5% ] 2.00% | 500 | 10.4% |
[ 2.0% - 2.5% ] 2.04% | 28,413 | 9.5% |
[ 2.0% - 2.5% ] 2.11% | 1,516 | 9.9% |
[ 2.0% - 2.5% ] 2.23% | 7,573 | 10.4% |
[ 2.0% - 2.5% ] 2.25% | 5,110 | 14.0% |
[ 2.0% - 2.5% ] 2.30% | 5,000 | 12.9% |
[ 2.0% - 2.5% ] 2.36% | 12,581 | 17.4% |
[ 2.5% - 3.0% ] 2.55% | 392 | 6.6% |
[ 2.5% - 3.0% ] 2.81% | 5,867 | 6.7% |
[ 3.0% - 3.5% ] 3.12% | 160 | 10.6% |
[ 3.0% - 3.5% ] 3.39% | 1,385 | 15.5% |
[ 3.5% - 4.0% ] 3.92% | 689 | 6.9% |
[ 4.0% - 4.5% ] 4.21% | 285 | 19.6% |
[ 4.0% - 4.5% ] 4.27% | 7,888 | 3.7% |
[ 4.0% - 4.5% ] 4.35% | 8,822 | 5.3% |
[ 5.5% - 6.0% ] 5.71% | 175 | 18.3% |
[ 5.5% - 6.0% ] 5.92% | 1,047 | 8.4% |
[ 6.0% - 6.5% ] 6.08% | 16,602 | 10.6% |
[ 6.5% - 7.0% ] 6.90% | 58 | 10.3% |