Paiute College, 1 year or more

COMPARE

Paiute
Race
Ancestry
AfghanAfricanAlaska NativeAlaskan AthabascanAlbanianAleutAlsatianAmericanApacheArabArapahoArgentineanArmenianAssyrian/Chaldean/SyriacAustralianAustrianBahamianBangladeshiBarbadianBasqueBelgianBelizeanBermudanBhutaneseBlackfeetBolivianBrazilianBritishBritish West IndianBulgarianBurmeseCajunCambodianCanadianCape VerdeanCarpatho RusynCelticCentral AmericanCentral American IndianCherokeeCheyenneChickasawChileanChineseChippewaChoctawColombianColvilleComancheCosta RicanCreeCreekCroatianCrowCubanCypriotCzechCzechoslovakianDanishDelawareDominicanDutchDutch West IndianEastern EuropeanEcuadorianEgyptianEnglishEstonianEthiopianEuropeanFijianFilipinoFinnishFrenchFrench American IndianFrench CanadianGermanGerman RussianGhanaianGreekGuamanian/ChamorroGuatemalanGuyaneseHaitianHmongHonduranHopiHoumaHungarianIcelanderIndian (Asian)IndonesianInupiatIranianIraqiIrishIroquoisIsraeliItalianJamaicanJapaneseJordanianKenyanKiowaKoreanLaotianLatvianLebaneseLiberianLithuanianLumbeeLuxembourgerMacedonianMalaysianMalteseMarshalleseMenomineeMexicanMexican American IndianMongolianMoroccanNative HawaiianNavajoNepaleseNew ZealanderNicaraguanNigerianNorthern EuropeanNorwegianOkinawanOsageOttawaPaiutePakistaniPalestinianPanamanianParaguayanPennsylvania GermanPeruvianPimaPolishPortuguesePotawatomiPuebloPuerto RicanPuget Sound SalishRomanianRussianSalvadoranSamoanScandinavianScotch-IrishScottishSeminoleSenegaleseSerbianShoshoneSierra LeoneanSiouxSlavicSlovakSloveneSomaliSouth AfricanSouth AmericanSouth American IndianSoviet UnionSpaniardSpanishSpanish AmericanSpanish American IndianSri LankanSubsaharan AfricanSudaneseSwedishSwissSyrianTaiwaneseThaiTlingit-HaidaTohono O'OdhamTonganTrinidadian and TobagonianTsimshianTurkishU.S. Virgin IslanderUgandanUkrainianUruguayanUteVenezuelanVietnameseWelshWest IndianYakamaYaquiYugoslavianYumanYup'ikZimbabwean
Immigration
NonimmigrantsImmigrantsAfghanistanAfricaAlbaniaArgentinaArmeniaAsiaAustraliaAustriaBahamasBangladeshBarbadosBelarusBelgiumBelizeBoliviaBosnia and HerzegovinaBrazilBulgariaBurma/MyanmarCabo VerdeCambodiaCameroonCanadaCaribbeanCentral AmericaChileChinaColombiaCongoCosta RicaCroatiaCubaCzechoslovakiaDenmarkDominicaDominican RepublicEastern AfricaEastern AsiaEastern EuropeEcuadorEgyptEl SalvadorEnglandEritreaEthiopiaEuropeFijiFranceGermanyGhanaGreeceGrenadaGuatemalaGuyanaHaitiHondurasHong KongHungaryIndiaIndonesiaIranIraqIrelandIsraelItalyJamaicaJapanJordanKazakhstanKenyaKoreaKuwaitLaosLatin AmericaLatviaLebanonLiberiaLithuaniaMalaysiaMexicoMicronesiaMiddle AfricaMoldovaMoroccoNepalNetherlandsNicaraguaNigeriaNorth AmericaNorth MacedoniaNorthern AfricaNorthern EuropeNorwayOceaniaPakistanPanamaPeruPhilippinesPolandPortugalRomaniaRussiaSaudi ArabiaScotlandSenegalSerbiaSierra LeoneSingaporeSomaliaSouth AfricaSouth AmericaSouth Central AsiaSouth Eastern AsiaSouthern EuropeSpainSri LankaSt. Vincent and the GrenadinesSudanSwedenSwitzerlandSyriaTaiwanThailandTrinidad and TobagoTurkeyUgandaUkraineUruguayUzbekistanVenezuelaVietnamWest IndiesWestern AfricaWestern AsiaWestern EuropeYemenZaireZimbabweAzores
Select to Compare
Race
Ancestry
AfghanAfricanAlaska NativeAlaskan AthabascanAlbanianAleutAlsatianAmericanApacheArabArapahoArgentineanArmenianAssyrian/Chaldean/SyriacAustralianAustrianBahamianBangladeshiBarbadianBasqueBelgianBelizeanBermudanBhutaneseBlackfeetBolivianBrazilianBritishBritish West IndianBulgarianBurmeseCajunCambodianCanadianCape VerdeanCarpatho RusynCelticCentral AmericanCentral American IndianCherokeeCheyenneChickasawChileanChineseChippewaChoctawColombianColvilleComancheCosta RicanCreeCreekCroatianCrowCubanCypriotCzechCzechoslovakianDanishDelawareDominicanDutchDutch West IndianEastern EuropeanEcuadorianEgyptianEnglishEstonianEthiopianEuropeanFijianFilipinoFinnishFrenchFrench American IndianFrench CanadianGermanGerman RussianGhanaianGreekGuamanian/ChamorroGuatemalanGuyaneseHaitianHmongHonduranHopiHoumaHungarianIcelanderIndian (Asian)IndonesianInupiatIranianIraqiIrishIroquoisIsraeliItalianJamaicanJapaneseJordanianKenyanKiowaKoreanLaotianLatvianLebaneseLiberianLithuanianLumbeeLuxembourgerMacedonianMalaysianMalteseMarshalleseMenomineeMexicanMexican American IndianMongolianMoroccanNative HawaiianNavajoNepaleseNew ZealanderNicaraguanNigerianNorthern EuropeanNorwegianOkinawanOsageOttawaPakistaniPalestinianPanamanianParaguayanPennsylvania GermanPeruvianPimaPolishPortuguesePotawatomiPuebloPuerto RicanPuget Sound SalishRomanianRussianSalvadoranSamoanScandinavianScotch-IrishScottishSeminoleSenegaleseSerbianShoshoneSierra LeoneanSiouxSlavicSlovakSloveneSomaliSouth AfricanSouth AmericanSouth American IndianSoviet UnionSpaniardSpanishSpanish AmericanSpanish American IndianSri LankanSubsaharan AfricanSudaneseSwedishSwissSyrianTaiwaneseThaiTlingit-HaidaTohono O'OdhamTonganTrinidadian and TobagonianTsimshianTurkishU.S. Virgin IslanderUgandanUkrainianUruguayanUteVenezuelanVietnameseWelshWest IndianYakamaYaquiYugoslavianYumanYup'ikZimbabwean
Immigration
NonimmigrantsImmigrantsAfghanistanAfricaAlbaniaArgentinaArmeniaAsiaAustraliaAustriaBahamasBangladeshBarbadosBelarusBelgiumBelizeBoliviaBosnia and HerzegovinaBrazilBulgariaBurma/MyanmarCabo VerdeCambodiaCameroonCanadaCaribbeanCentral AmericaChileChinaColombiaCongoCosta RicaCroatiaCubaCzechoslovakiaDenmarkDominicaDominican RepublicEastern AfricaEastern AsiaEastern EuropeEcuadorEgyptEl SalvadorEnglandEritreaEthiopiaEuropeFijiFranceGermanyGhanaGreeceGrenadaGuatemalaGuyanaHaitiHondurasHong KongHungaryIndiaIndonesiaIranIraqIrelandIsraelItalyJamaicaJapanJordanKazakhstanKenyaKoreaKuwaitLaosLatin AmericaLatviaLebanonLiberiaLithuaniaMalaysiaMexicoMicronesiaMiddle AfricaMoldovaMoroccoNepalNetherlandsNicaraguaNigeriaNorth AmericaNorth MacedoniaNorthern AfricaNorthern EuropeNorwayOceaniaPakistanPanamaPeruPhilippinesPolandPortugalRomaniaRussiaSaudi ArabiaScotlandSenegalSerbiaSierra LeoneSingaporeSomaliaSouth AfricaSouth AmericaSouth Central AsiaSouth Eastern AsiaSouthern EuropeSpainSri LankaSt. Vincent and the GrenadinesSudanSwedenSwitzerlandSyriaTaiwanThailandTrinidad and TobagoTurkeyUgandaUkraineUruguayUzbekistanVenezuelaVietnamWest IndiesWestern AfricaWestern AsiaWestern EuropeYemenZaireZimbabweAzores
College, 1 year or more
Income
Poverty
Unemployment
Labor Participation
Family Structure
Vehicle Availability
Education Level
Disability

Paiute College, 1 year or more
Tragic

52.9%
COLLEGE, 1 YEAR OR MORE
0.0/ 100
METRIC RATING
297th/ 347
METRIC RANK

Paiute College, 1 year or more Correlation Chart

The statistical analysis conducted on geographies consisting of 58,404,248 people shows a mild negative correlation between the proportion of Paiute and percentage of population with at least college, 1 year or more education in the United States with a correlation coefficient (R) of -0.344 and weighted average of 52.9%. On average, for every 1% (one percent) increase in Paiute within a typical geography, there is a decrease of 0.14% in percentage of population with at least college, 1 year or more education.
Paiute College, 1 year or more
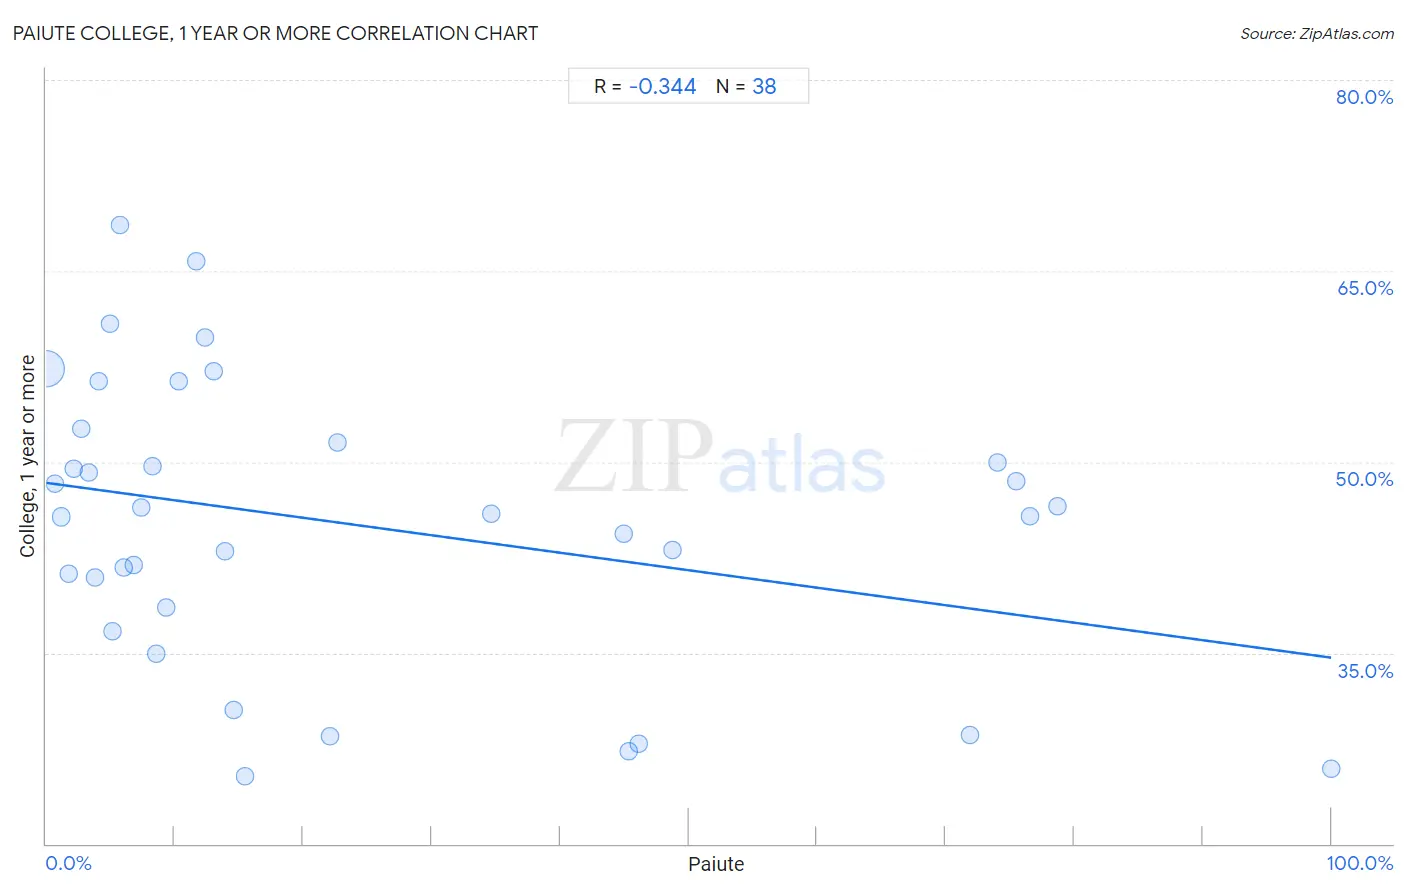
It is essential to understand that the correlation between the percentage of Paiute and percentage of population with at least college, 1 year or more education does not imply a direct cause-and-effect relationship. It remains uncertain whether the presence of Paiute influences an upward or downward trend in the level of percentage of population with at least college, 1 year or more education within an area, or if Paiute simply ended up residing in those areas with higher or lower levels of percentage of population with at least college, 1 year or more education due to other factors.

Demographics Similar to Paiute by College, 1 year or more

In terms of college, 1 year or more, the demographic groups most similar to Paiute are Sioux (53.0%, a difference of 0.28%), Immigrants from Dominica (52.5%, a difference of 0.59%), Yaqui (53.2%, a difference of 0.62%), Cherokee (53.2%, a difference of 0.63%), and Black/African American (53.3%, a difference of 0.84%).
DemographicsRating | RankCollege, 1 year or more
Alaskan Athabascans
0.0
/100
|
#290
Tragic
53.4%
Cubans
0.0
/100
|
#291
Tragic
53.4%
Chickasaw
0.0
/100
|
#292
Tragic
53.3%
Blacks/African Americans
0.0
/100
|
#293
Tragic
53.3%
Cherokee
0.0
/100
|
#294
Tragic
53.2%
Yaqui
0.0
/100
|
#295
Tragic
53.2%
Sioux
0.0
/100
|
#296
Tragic
53.0%
Paiute
0.0
/100
|
#297
Tragic
52.9%
Immigrants from Dominica
0.0
/100
|
#298
Tragic
52.5%
Immigrants from Nicaragua
0.0
/100
|
#299
Tragic
52.4%
Choctaw
0.0
/100
|
#300
Tragic
52.3%
Haitians
0.0
/100
|
#301
Tragic
52.3%
Puerto Ricans
0.0
/100
|
#302
Tragic
52.2%
Creek
0.0
/100
|
#303
Tragic
52.2%
Central Americans
0.0
/100
|
#304
Tragic
52.1%

Paiute College, 1 year or more Correlation Summary

MeasurementPaiute DataCollege, 1 year or more Data
Minimum0.030%25.3%
Maximum100.0%68.6%
Range100.0%43.4%
Mean24.1%45.0%
Median11.0%45.9%
Interquartile 25% (IQ1)4.9%38.5%
Interquartile 75% (IQ3)45.0%51.5%
Interquartile Range (IQR)40.1%13.0%
Standard Deviation (Sample)27.9%11.2%
Standard Deviation (Population)27.6%11.0%

Correlation Details

Paiute PercentileSample SizeCollege, 1 year or more
[
0.0%
-
0.5%
]
0.030%
57,651,65757.4%
[
0.5%
-
1.0%
]
0.68%
501,25948.3%
[
1.0%
-
1.5%
]
1.21%
145,16545.7%
[
1.5%
-
2.0%
]
1.75%
29,12541.3%
[
2.0%
-
2.5%
]
2.12%
8,78049.4%
[
2.5%
-
3.0%
]
2.74%
9,32852.6%
[
3.0%
-
3.5%
]
3.28%
57949.1%
[
3.5%
-
4.0%
]
3.76%
1,91640.9%
[
4.0%
-
4.5%
]
4.04%
15,90156.3%
[
4.5%
-
5.0%
]
4.92%
1,56560.9%
[
5.0%
-
5.5%
]
5.12%
6,29536.7%
[
5.5%
-
6.0%
]
5.74%
1,13368.6%
[
6.0%
-
6.5%
]
6.02%
3,10841.7%
[
6.5%
-
7.0%
]
6.80%
8,47241.9%
[
7.0%
-
7.5%
]
7.39%
1,70546.4%
[
8.0%
-
8.5%
]
8.24%
72849.7%
[
8.5%
-
9.0%
]
8.52%
77534.9%
[
9.0%
-
9.5%
]
9.38%
1,88638.5%
[
10.0%
-
10.5%
]
10.35%
3,03456.4%
[
11.5%
-
12.0%
]
11.70%
77865.8%
[
12.0%
-
12.5%
]
12.31%
1,64959.8%
[
12.5%
-
13.0%
]
12.99%
1,56357.1%
[
13.5%
-
14.0%
]
13.90%
37442.9%
[
14.5%
-
15.0%
]
14.63%
1,03230.5%
[
15.0%
-
15.5%
]
15.43%
36325.3%
[
22.0%
-
22.5%
]
22.05%
25428.4%
[
22.5%
-
23.0%
]
22.68%
31351.5%
[
34.5%
-
35.0%
]
34.61%
39345.9%
[
44.5%
-
45.0%
]
44.98%
88744.4%
[
45.0%
-
45.5%
]
45.35%
17227.3%
[
46.0%
-
46.5%
]
46.15%
16927.9%
[
48.5%
-
49.0%
]
48.76%
1,00743.1%
[
71.5%
-
72.0%
]
71.85%
13528.6%
[
73.5%
-
74.0%
]
74.00%
89649.9%
[
75.0%
-
75.5%
]
75.46%
1,08448.5%
[
76.5%
-
77.0%
]
76.59%
39345.8%
[
78.5%
-
79.0%
]
78.74%
34846.6%
[
99.5%
-
100.0%
]
100.00%
2725.9%