Immigrants from Yemen Divorced or Separated
COMPARE
Immigrants from Yemen
Select to Compare
Divorced or Separated
Immigrants from Yemen Divorced or Separated
11.3%
DIVORCED OR SEPARATED
99.9/ 100
METRIC RATING
55th/ 347
METRIC RANK
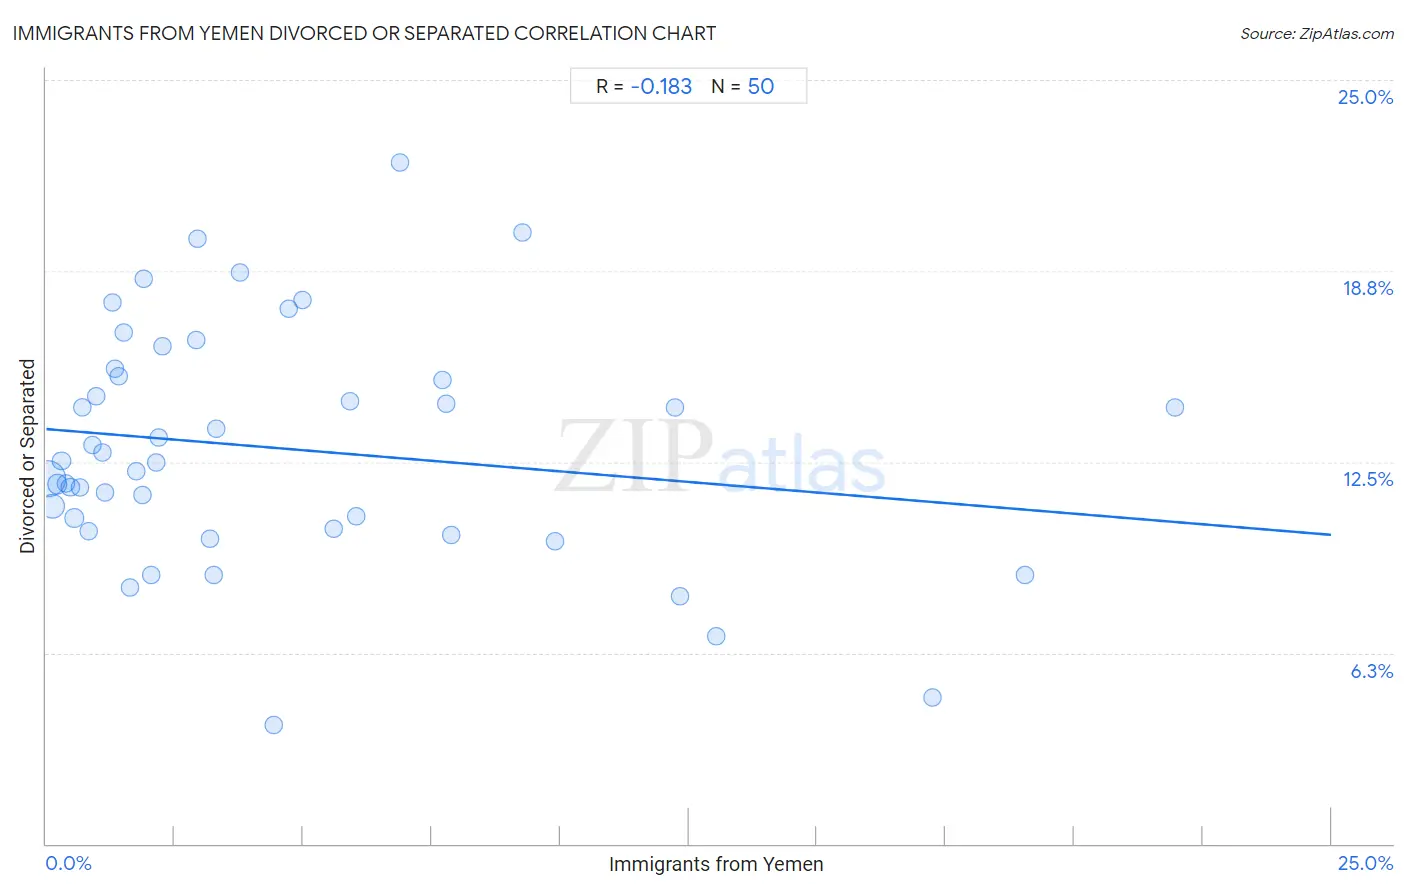
Immigrants from Yemen Divorced or Separated Correlation Chart
The statistical analysis conducted on geographies consisting of 82,433,214 people shows a poor negative correlation between the proportion of Immigrants from Yemen and percentage of population currently divorced or separated in the United States with a correlation coefficient (R) of -0.183 and weighted average of 11.3%. On average, for every 1% (one percent) increase in Immigrants from Yemen within a typical geography, there is a decrease of 0.14% in percentage of population currently divorced or separated.
It is essential to understand that the correlation between the percentage of Immigrants from Yemen and percentage of population currently divorced or separated does not imply a direct cause-and-effect relationship. It remains uncertain whether the presence of Immigrants from Yemen influences an upward or downward trend in the level of percentage of population currently divorced or separated within an area, or if Immigrants from Yemen simply ended up residing in those areas with higher or lower levels of percentage of population currently divorced or separated due to other factors.
Demographics Similar to Immigrants from Yemen by Divorced or Separated
In terms of divorced or separated, the demographic groups most similar to Immigrants from Yemen are Eastern European (11.3%, a difference of 0.010%), Immigrants from Philippines (11.3%, a difference of 0.070%), Immigrants from Vietnam (11.3%, a difference of 0.070%), Immigrants from Lithuania (11.3%, a difference of 0.12%), and Sri Lankan (11.3%, a difference of 0.14%).
| Demographics | Rating | Rank | Divorced or Separated |
| Immigrants from Turkey | 100.0 /100 | #48 | Exceptional 11.2% |
| Immigrants from Saudi Arabia | 100.0 /100 | #49 | Exceptional 11.2% |
| Bolivians | 100.0 /100 | #50 | Exceptional 11.2% |
| Immigrants from Bolivia | 100.0 /100 | #51 | Exceptional 11.3% |
| Immigrants from Australia | 99.9 /100 | #52 | Exceptional 11.3% |
| Immigrants from Lithuania | 99.9 /100 | #53 | Exceptional 11.3% |
| Eastern Europeans | 99.9 /100 | #54 | Exceptional 11.3% |
| Immigrants from Yemen | 99.9 /100 | #55 | Exceptional 11.3% |
| Immigrants from Philippines | 99.9 /100 | #56 | Exceptional 11.3% |
| Immigrants from Vietnam | 99.9 /100 | #57 | Exceptional 11.3% |
| Sri Lankans | 99.9 /100 | #58 | Exceptional 11.3% |
| Israelis | 99.9 /100 | #59 | Exceptional 11.3% |
| Immigrants from Russia | 99.9 /100 | #60 | Exceptional 11.3% |
| Koreans | 99.9 /100 | #61 | Exceptional 11.3% |
| Luxembourgers | 99.9 /100 | #62 | Exceptional 11.3% |
Immigrants from Yemen Divorced or Separated Correlation Summary
| Measurement | Immigrants from Yemen Data | Divorced or Separated Data |
| Minimum | 0.021% | 3.9% |
| Maximum | 22.0% | 22.3% |
| Range | 21.9% | 18.4% |
| Mean | 4.5% | 12.9% |
| Median | 2.2% | 12.5% |
| Interquartile 25% (IQ1) | 1.1% | 10.3% |
| Interquartile 75% (IQ3) | 6.0% | 15.3% |
| Interquartile Range (IQR) | 4.9% | 5.0% |
| Standard Deviation (Sample) | 5.1% | 3.9% |
| Standard Deviation (Population) | 5.1% | 3.8% |
Correlation Details
| Immigrants from Yemen Percentile | Sample Size | Divorced or Separated |
[ 0.0% - 0.5% ] 0.021% | 52,178,584 | 12.0% |
[ 0.0% - 0.5% ] 0.12% | 17,218,052 | 11.0% |
[ 0.0% - 0.5% ] 0.21% | 4,583,174 | 11.8% |
[ 0.0% - 0.5% ] 0.29% | 2,107,407 | 12.5% |
[ 0.0% - 0.5% ] 0.38% | 1,744,676 | 11.8% |
[ 0.0% - 0.5% ] 0.46% | 1,571,858 | 11.7% |
[ 0.5% - 1.0% ] 0.55% | 507,712 | 10.7% |
[ 0.5% - 1.0% ] 0.66% | 280,364 | 11.6% |
[ 0.5% - 1.0% ] 0.70% | 897,069 | 14.3% |
[ 0.5% - 1.0% ] 0.82% | 228,654 | 10.2% |
[ 0.5% - 1.0% ] 0.89% | 77,809 | 13.0% |
[ 0.5% - 1.0% ] 0.97% | 127,787 | 14.7% |
[ 1.0% - 1.5% ] 1.09% | 49,141 | 12.8% |
[ 1.0% - 1.5% ] 1.13% | 66,881 | 11.5% |
[ 1.0% - 1.5% ] 1.28% | 702 | 17.7% |
[ 1.0% - 1.5% ] 1.33% | 17,992 | 15.5% |
[ 1.0% - 1.5% ] 1.42% | 78,750 | 15.3% |
[ 1.0% - 1.5% ] 1.50% | 83,652 | 16.7% |
[ 1.5% - 2.0% ] 1.62% | 8,765 | 8.4% |
[ 1.5% - 2.0% ] 1.76% | 20,503 | 12.2% |
[ 1.5% - 2.0% ] 1.88% | 78,932 | 11.4% |
[ 1.5% - 2.0% ] 1.90% | 12,771 | 18.5% |
[ 2.0% - 2.5% ] 2.03% | 23,565 | 8.8% |
[ 2.0% - 2.5% ] 2.14% | 16,896 | 12.5% |
[ 2.0% - 2.5% ] 2.20% | 42,548 | 13.3% |
[ 2.0% - 2.5% ] 2.26% | 1,596 | 16.3% |
[ 2.5% - 3.0% ] 2.93% | 4,716 | 16.5% |
[ 2.5% - 3.0% ] 2.93% | 8,284 | 19.8% |
[ 3.0% - 3.5% ] 3.18% | 1,889 | 10.0% |
[ 3.0% - 3.5% ] 3.27% | 1,837 | 8.8% |
[ 3.0% - 3.5% ] 3.31% | 2,630 | 13.6% |
[ 3.5% - 4.0% ] 3.77% | 24,990 | 18.7% |
[ 4.0% - 4.5% ] 4.42% | 2,487 | 3.9% |
[ 4.5% - 5.0% ] 4.71% | 20,936 | 17.5% |
[ 4.5% - 5.0% ] 4.99% | 19,762 | 17.8% |
[ 5.5% - 6.0% ] 5.60% | 26,547 | 10.3% |
[ 5.5% - 6.0% ] 5.91% | 1,303 | 14.5% |
[ 6.0% - 6.5% ] 6.02% | 25,278 | 10.7% |
[ 6.5% - 7.0% ] 6.88% | 13,704 | 22.3% |
[ 7.5% - 8.0% ] 7.71% | 778 | 15.2% |
[ 7.5% - 8.0% ] 7.78% | 1,967 | 14.4% |
[ 7.5% - 8.0% ] 7.89% | 108,414 | 10.1% |
[ 9.0% - 9.5% ] 9.28% | 1,132 | 20.0% |
[ 9.5% - 10.0% ] 9.90% | 1,546 | 9.9% |
[ 12.0% - 12.5% ] 12.22% | 630 | 14.3% |
[ 12.0% - 12.5% ] 12.32% | 53,044 | 8.1% |
[ 13.0% - 13.5% ] 13.03% | 43,213 | 6.8% |
[ 17.0% - 17.5% ] 17.25% | 27,842 | 4.8% |
[ 19.0% - 19.5% ] 19.05% | 8,919 | 8.8% |
[ 21.5% - 22.0% ] 21.97% | 5,526 | 14.3% |