Immigrants from Greece Disability Age Under 5
COMPARE
Immigrants from Greece
Select to Compare
Disability Age Under 5
Immigrants from Greece Disability Age Under 5
1.3%
DISABILITY | AGE UNDER 5
19.1/ 100
METRIC RATING
211th/ 347
METRIC RANK
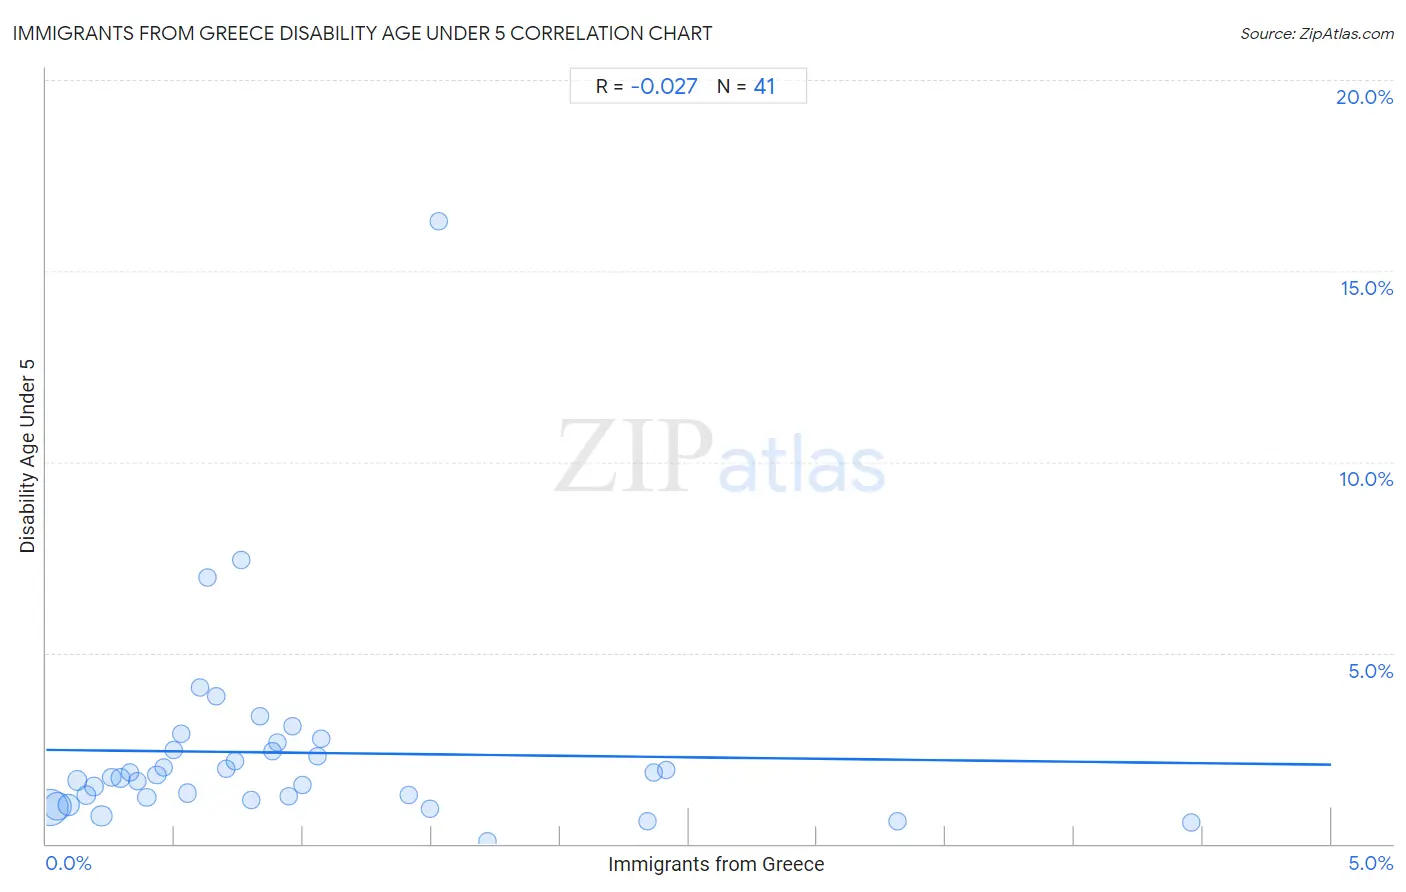
Immigrants from Greece Disability Age Under 5 Correlation Chart
The statistical analysis conducted on geographies consisting of 132,613,079 people shows no correlation between the proportion of Immigrants from Greece and percentage of population with a disability under the age of 5 in the United States with a correlation coefficient (R) of -0.027 and weighted average of 1.3%. On average, for every 1% (one percent) increase in Immigrants from Greece within a typical geography, there is a decrease of 0.078% in percentage of population with a disability under the age of 5.
It is essential to understand that the correlation between the percentage of Immigrants from Greece and percentage of population with a disability under the age of 5 does not imply a direct cause-and-effect relationship. It remains uncertain whether the presence of Immigrants from Greece influences an upward or downward trend in the level of percentage of population with a disability under the age of 5 within an area, or if Immigrants from Greece simply ended up residing in those areas with higher or lower levels of percentage of population with a disability under the age of 5 due to other factors.
Demographics Similar to Immigrants from Greece by Disability Age Under 5
In terms of disability age under 5, the demographic groups most similar to Immigrants from Greece are Pakistani (1.3%, a difference of 0.040%), Chilean (1.3%, a difference of 0.040%), Bulgarian (1.3%, a difference of 0.050%), Immigrants from Sudan (1.3%, a difference of 0.060%), and Mexican (1.3%, a difference of 0.23%).
| Demographics | Rating | Rank | Disability Age Under 5 |
| Immigrants from Europe | 23.6 /100 | #204 | Fair 1.3% |
| Romanians | 22.5 /100 | #205 | Fair 1.3% |
| Immigrants from Poland | 22.4 /100 | #206 | Fair 1.3% |
| Nigerians | 21.2 /100 | #207 | Fair 1.3% |
| Mexicans | 20.8 /100 | #208 | Fair 1.3% |
| Bulgarians | 19.5 /100 | #209 | Poor 1.3% |
| Pakistanis | 19.4 /100 | #210 | Poor 1.3% |
| Immigrants from Greece | 19.1 /100 | #211 | Poor 1.3% |
| Chileans | 18.8 /100 | #212 | Poor 1.3% |
| Immigrants from Sudan | 18.7 /100 | #213 | Poor 1.3% |
| Immigrants from Chile | 17.2 /100 | #214 | Poor 1.3% |
| Syrians | 16.1 /100 | #215 | Poor 1.3% |
| Bangladeshis | 15.5 /100 | #216 | Poor 1.3% |
| Cypriots | 14.9 /100 | #217 | Poor 1.3% |
| Malaysians | 13.2 /100 | #218 | Poor 1.3% |
Immigrants from Greece Disability Age Under 5 Correlation Summary
| Measurement | Immigrants from Greece Data | Disability Age Under 5 Data |
| Minimum | 0.017% | 0.058% |
| Maximum | 4.5% | 16.3% |
| Range | 4.4% | 16.2% |
| Mean | 0.94% | 2.4% |
| Median | 0.70% | 1.7% |
| Interquartile 25% (IQ1) | 0.34% | 1.2% |
| Interquartile 75% (IQ3) | 1.1% | 2.6% |
| Interquartile Range (IQR) | 0.72% | 1.4% |
| Standard Deviation (Sample) | 0.92% | 2.7% |
| Standard Deviation (Population) | 0.91% | 2.6% |
Correlation Details
| Immigrants from Greece Percentile | Sample Size | Disability Age Under 5 |
[ 0.0% - 0.5% ] 0.017% | 60,937,392 | 0.94% |
[ 0.0% - 0.5% ] 0.046% | 32,286,036 | 0.99% |
[ 0.0% - 0.5% ] 0.085% | 12,518,701 | 1.0% |
[ 0.0% - 0.5% ] 0.12% | 5,033,668 | 1.7% |
[ 0.0% - 0.5% ] 0.16% | 3,362,838 | 1.3% |
[ 0.0% - 0.5% ] 0.19% | 2,310,858 | 1.5% |
[ 0.0% - 0.5% ] 0.21% | 10,211,964 | 0.73% |
[ 0.0% - 0.5% ] 0.25% | 1,010,721 | 1.7% |
[ 0.0% - 0.5% ] 0.29% | 850,442 | 1.7% |
[ 0.0% - 0.5% ] 0.32% | 514,240 | 1.9% |
[ 0.0% - 0.5% ] 0.36% | 422,498 | 1.6% |
[ 0.0% - 0.5% ] 0.39% | 744,106 | 1.2% |
[ 0.0% - 0.5% ] 0.43% | 269,381 | 1.8% |
[ 0.0% - 0.5% ] 0.46% | 275,723 | 2.0% |
[ 0.0% - 0.5% ] 0.50% | 194,367 | 2.5% |
[ 0.5% - 1.0% ] 0.53% | 22,435 | 2.9% |
[ 0.5% - 1.0% ] 0.55% | 160,628 | 1.3% |
[ 0.5% - 1.0% ] 0.60% | 85,711 | 4.1% |
[ 0.5% - 1.0% ] 0.63% | 58,665 | 7.0% |
[ 0.5% - 1.0% ] 0.66% | 93,223 | 3.9% |
[ 0.5% - 1.0% ] 0.70% | 182,334 | 2.0% |
[ 0.5% - 1.0% ] 0.73% | 209,713 | 2.2% |
[ 0.5% - 1.0% ] 0.76% | 40,640 | 7.4% |
[ 0.5% - 1.0% ] 0.80% | 63,920 | 1.2% |
[ 0.5% - 1.0% ] 0.83% | 13,213 | 3.3% |
[ 0.5% - 1.0% ] 0.88% | 65,677 | 2.4% |
[ 0.5% - 1.0% ] 0.90% | 95,122 | 2.6% |
[ 0.5% - 1.0% ] 0.94% | 26,488 | 1.3% |
[ 0.5% - 1.0% ] 0.96% | 59,918 | 3.1% |
[ 0.5% - 1.0% ] 1.00% | 26,322 | 1.5% |
[ 1.0% - 1.5% ] 1.05% | 30,857 | 2.3% |
[ 1.0% - 1.5% ] 1.07% | 159,379 | 2.7% |
[ 1.0% - 1.5% ] 1.41% | 48,615 | 1.3% |
[ 1.0% - 1.5% ] 1.49% | 40,198 | 0.92% |
[ 1.5% - 2.0% ] 1.53% | 1,639 | 16.3% |
[ 1.5% - 2.0% ] 1.72% | 29,544 | 0.058% |
[ 2.0% - 2.5% ] 2.34% | 37,647 | 0.59% |
[ 2.0% - 2.5% ] 2.36% | 27,076 | 1.9% |
[ 2.0% - 2.5% ] 2.41% | 25,355 | 1.9% |
[ 3.0% - 3.5% ] 3.31% | 27,069 | 0.58% |
[ 4.0% - 4.5% ] 4.45% | 38,756 | 0.57% |