Immigrants from Bolivia Wage/Income Gap
COMPARE
Immigrants from Bolivia
Select to Compare
Wage/Income Gap
Immigrants from Bolivia Wage/Income Gap
26.0%
WAGE/INCOME GAP
36.4/ 100
METRIC RATING
181st/ 347
METRIC RANK
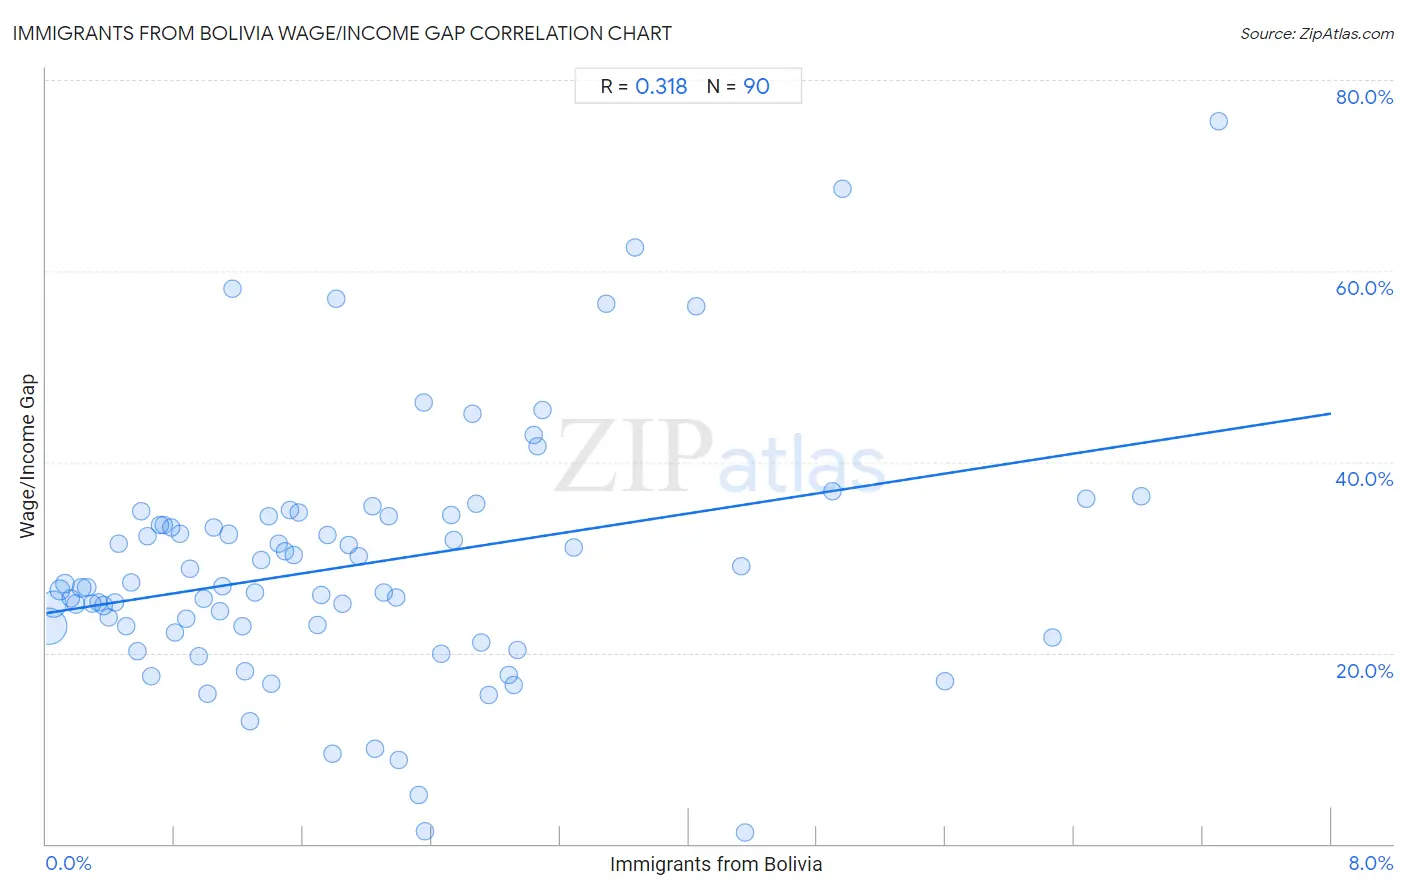
Immigrants from Bolivia Wage/Income Gap Correlation Chart
The statistical analysis conducted on geographies consisting of 158,701,759 people shows a mild positive correlation between the proportion of Immigrants from Bolivia and wage/income gap percentage in the United States with a correlation coefficient (R) of 0.318 and weighted average of 26.0%. On average, for every 1% (one percent) increase in Immigrants from Bolivia within a typical geography, there is an increase of 2.6% in wage/income gap percentage.
It is essential to understand that the correlation between the percentage of Immigrants from Bolivia and wage/income gap percentage does not imply a direct cause-and-effect relationship. It remains uncertain whether the presence of Immigrants from Bolivia influences an upward or downward trend in the level of wage/income gap percentage within an area, or if Immigrants from Bolivia simply ended up residing in those areas with higher or lower levels of wage/income gap percentage due to other factors.
Demographics Similar to Immigrants from Bolivia by Wage/Income Gap
In terms of wage/income gap, the demographic groups most similar to Immigrants from Bolivia are Immigrants from Serbia (26.0%, a difference of 0.070%), Immigrants from Kazakhstan (26.0%, a difference of 0.090%), Guamanian/Chamorro (26.0%, a difference of 0.11%), Mexican (26.0%, a difference of 0.14%), and Samoan (26.0%, a difference of 0.15%).
| Demographics | Rating | Rank | Wage/Income Gap |
| Alaskan Athabascans | 50.0 /100 | #174 | Average 25.8% |
| Sri Lankans | 47.0 /100 | #175 | Average 25.8% |
| Paraguayans | 46.7 /100 | #176 | Average 25.8% |
| Cambodians | 45.1 /100 | #177 | Average 25.8% |
| Chinese | 42.0 /100 | #178 | Average 25.9% |
| Samoans | 38.6 /100 | #179 | Fair 26.0% |
| Guamanians/Chamorros | 38.0 /100 | #180 | Fair 26.0% |
| Immigrants from Bolivia | 36.4 /100 | #181 | Fair 26.0% |
| Immigrants from Serbia | 35.4 /100 | #182 | Fair 26.0% |
| Immigrants from Kazakhstan | 35.2 /100 | #183 | Fair 26.0% |
| Mexicans | 34.4 /100 | #184 | Fair 26.0% |
| Pakistanis | 33.7 /100 | #185 | Fair 26.1% |
| Immigrants from Indonesia | 32.5 /100 | #186 | Fair 26.1% |
| Palestinians | 29.9 /100 | #187 | Fair 26.1% |
| Immigrants from Egypt | 29.9 /100 | #188 | Fair 26.1% |
Immigrants from Bolivia Wage/Income Gap Correlation Summary
| Measurement | Immigrants from Bolivia Data | Wage/Income Gap Data |
| Minimum | 0.017% | 1.1% |
| Maximum | 7.3% | 75.7% |
| Range | 7.3% | 74.6% |
| Mean | 1.9% | 29.2% |
| Median | 1.5% | 26.9% |
| Interquartile 25% (IQ1) | 0.78% | 22.8% |
| Interquartile 75% (IQ3) | 2.7% | 34.2% |
| Interquartile Range (IQR) | 1.9% | 11.5% |
| Standard Deviation (Sample) | 1.6% | 13.1% |
| Standard Deviation (Population) | 1.6% | 13.1% |
Correlation Details
| Immigrants from Bolivia Percentile | Sample Size | Wage/Income Gap |
[ 0.0% - 0.5% ] 0.017% | 83,887,468 | 22.8% |
[ 0.0% - 0.5% ] 0.048% | 35,286,923 | 25.1% |
[ 0.0% - 0.5% ] 0.084% | 11,396,724 | 26.6% |
[ 0.0% - 0.5% ] 0.12% | 6,167,811 | 27.3% |
[ 0.0% - 0.5% ] 0.15% | 3,871,589 | 25.7% |
[ 0.0% - 0.5% ] 0.19% | 3,581,047 | 25.1% |
[ 0.0% - 0.5% ] 0.22% | 2,227,270 | 26.8% |
[ 0.0% - 0.5% ] 0.25% | 1,463,914 | 26.9% |
[ 0.0% - 0.5% ] 0.29% | 1,155,062 | 25.2% |
[ 0.0% - 0.5% ] 0.32% | 1,423,729 | 25.3% |
[ 0.0% - 0.5% ] 0.36% | 780,303 | 25.0% |
[ 0.0% - 0.5% ] 0.39% | 612,977 | 23.7% |
[ 0.0% - 0.5% ] 0.43% | 589,994 | 25.2% |
[ 0.0% - 0.5% ] 0.45% | 502,928 | 31.5% |
[ 0.0% - 0.5% ] 0.50% | 490,787 | 22.8% |
[ 0.5% - 1.0% ] 0.53% | 346,390 | 27.3% |
[ 0.5% - 1.0% ] 0.57% | 570,041 | 20.1% |
[ 0.5% - 1.0% ] 0.59% | 191,430 | 34.8% |
[ 0.5% - 1.0% ] 0.63% | 275,710 | 32.2% |
[ 0.5% - 1.0% ] 0.66% | 235,620 | 17.6% |
[ 0.5% - 1.0% ] 0.71% | 181,087 | 33.3% |
[ 0.5% - 1.0% ] 0.73% | 157,712 | 33.4% |
[ 0.5% - 1.0% ] 0.78% | 121,214 | 33.1% |
[ 0.5% - 1.0% ] 0.80% | 214,310 | 22.1% |
[ 0.5% - 1.0% ] 0.84% | 158,854 | 32.5% |
[ 0.5% - 1.0% ] 0.87% | 231,692 | 23.5% |
[ 0.5% - 1.0% ] 0.90% | 206,292 | 28.8% |
[ 0.5% - 1.0% ] 0.95% | 154,708 | 19.6% |
[ 0.5% - 1.0% ] 0.98% | 111,618 | 25.6% |
[ 1.0% - 1.5% ] 1.00% | 96,307 | 15.7% |
[ 1.0% - 1.5% ] 1.04% | 125,771 | 33.1% |
[ 1.0% - 1.5% ] 1.08% | 297,707 | 24.4% |
[ 1.0% - 1.5% ] 1.10% | 19,401 | 26.9% |
[ 1.0% - 1.5% ] 1.14% | 105,029 | 32.4% |
[ 1.0% - 1.5% ] 1.16% | 16,620 | 58.1% |
[ 1.0% - 1.5% ] 1.22% | 31,235 | 22.8% |
[ 1.0% - 1.5% ] 1.24% | 22,339 | 18.1% |
[ 1.0% - 1.5% ] 1.26% | 40,956 | 12.9% |
[ 1.0% - 1.5% ] 1.30% | 35,353 | 26.3% |
[ 1.0% - 1.5% ] 1.34% | 5,663 | 29.7% |
[ 1.0% - 1.5% ] 1.38% | 54,699 | 34.2% |
[ 1.0% - 1.5% ] 1.40% | 36,063 | 16.8% |
[ 1.0% - 1.5% ] 1.45% | 63,973 | 31.4% |
[ 1.0% - 1.5% ] 1.48% | 118,205 | 30.7% |
[ 1.5% - 2.0% ] 1.52% | 113,497 | 35.0% |
[ 1.5% - 2.0% ] 1.54% | 21,991 | 30.3% |
[ 1.5% - 2.0% ] 1.57% | 114,723 | 34.7% |
[ 1.5% - 2.0% ] 1.69% | 19,372 | 22.9% |
[ 1.5% - 2.0% ] 1.71% | 6,359 | 26.0% |
[ 1.5% - 2.0% ] 1.75% | 24,242 | 32.3% |
[ 1.5% - 2.0% ] 1.79% | 7,057 | 9.4% |
[ 1.5% - 2.0% ] 1.81% | 1,604 | 57.1% |
[ 1.5% - 2.0% ] 1.84% | 27,734 | 25.2% |
[ 1.5% - 2.0% ] 1.89% | 65,644 | 31.3% |
[ 1.5% - 2.0% ] 1.94% | 31,022 | 30.1% |
[ 2.0% - 2.5% ] 2.03% | 44,959 | 35.4% |
[ 2.0% - 2.5% ] 2.05% | 8,975 | 10.0% |
[ 2.0% - 2.5% ] 2.10% | 9,141 | 26.4% |
[ 2.0% - 2.5% ] 2.13% | 17,788 | 34.3% |
[ 2.0% - 2.5% ] 2.18% | 3,851 | 25.8% |
[ 2.0% - 2.5% ] 2.19% | 5,790 | 8.8% |
[ 2.0% - 2.5% ] 2.32% | 24,785 | 5.1% |
[ 2.0% - 2.5% ] 2.35% | 1,790 | 46.2% |
[ 2.0% - 2.5% ] 2.36% | 38,077 | 1.3% |
[ 2.0% - 2.5% ] 2.46% | 26,573 | 19.9% |
[ 2.5% - 3.0% ] 2.52% | 58,872 | 34.5% |
[ 2.5% - 3.0% ] 2.54% | 58,775 | 31.8% |
[ 2.5% - 3.0% ] 2.65% | 15,459 | 45.0% |
[ 2.5% - 3.0% ] 2.68% | 43,882 | 35.6% |
[ 2.5% - 3.0% ] 2.71% | 1,883 | 21.0% |
[ 2.5% - 3.0% ] 2.76% | 52,359 | 15.6% |
[ 2.5% - 3.0% ] 2.88% | 347 | 17.6% |
[ 2.5% - 3.0% ] 2.91% | 19,812 | 16.6% |
[ 2.5% - 3.0% ] 2.94% | 16,827 | 20.3% |
[ 3.0% - 3.5% ] 3.03% | 2,573 | 42.8% |
[ 3.0% - 3.5% ] 3.06% | 4,218 | 41.6% |
[ 3.0% - 3.5% ] 3.09% | 6,510 | 45.5% |
[ 3.0% - 3.5% ] 3.29% | 49,246 | 31.0% |
[ 3.0% - 3.5% ] 3.49% | 1,463 | 56.6% |
[ 3.5% - 4.0% ] 3.66% | 6,772 | 62.4% |
[ 4.0% - 4.5% ] 4.04% | 2,052 | 56.4% |
[ 4.0% - 4.5% ] 4.33% | 1,202 | 29.0% |
[ 4.0% - 4.5% ] 4.35% | 4,003 | 1.1% |
[ 4.5% - 5.0% ] 4.90% | 4,024 | 37.0% |
[ 4.5% - 5.0% ] 4.96% | 746 | 68.5% |
[ 5.5% - 6.0% ] 5.59% | 34,860 | 17.0% |
[ 6.0% - 6.5% ] 6.27% | 31,121 | 21.5% |
[ 6.0% - 6.5% ] 6.47% | 2,533 | 36.2% |
[ 6.5% - 7.0% ] 6.82% | 1,584 | 36.4% |
[ 7.0% - 7.5% ] 7.30% | 1,137 | 75.7% |